Decoding ECGs: A Practical Guide to Medical Terminology
When a patient comes in with a faint pulse or an irregular heartbeat, the first thing a clinician often checks is an electrocardiogram, or ECG. This simple test captures the heart’s electrical activity in a visual form. Yet for anyone new to cardiology, the lines, waves, and annotations can feel like a secret language. Decoding ECGs is not just about spotting a spike; it’s about understanding the vocabulary that tells a story of rhythm, conduction, and potential danger.
Why Understanding ECG Terminology Matters
Every element on an ECG trace—from the gentle rise of the P wave to the sharp notch of the QRS complex—carries diagnostic weight. A single mislabeled segment can lead to misdiagnosis, delayed treatment, or unnecessary procedures. Mastering the terminology also improves communication with colleagues, enhances patient counseling, and builds confidence for trainees and seasoned practitioners alike.
Decoding ECGs: Core Terminology
The ECG canvas is organized into several key components. Below is a quick reference to the most commonly referenced terms.
- P wave – represents atrial depolarization. A normal P wave is smooth and rounded.
- PR interval – time from the beginning of the P wave to the start of the QRS complex. It reflects AV nodal conduction.
- QRS complex – ventricular depolarization. Its duration and morphology can reveal bundle branch blocks or ventricular hypertrophy.
- ST segment – the flat section between QRS and T wave. Elevation or depression hints at ischemia.
- T wave – ventricular repolarization. Its shape and symmetry provide clues about electrolyte balance.
- QT interval – period from Q onset to T end. Prolongation increases the risk of torsades de pointes.
- Heart rate (RR interval) – measured by the distance between successive R peaks.
Common Rhythm Patterns and Their Names
Once you can identify the individual waves, the next step is recognizing the rhythm. Here are some classic patterns and what they signify:
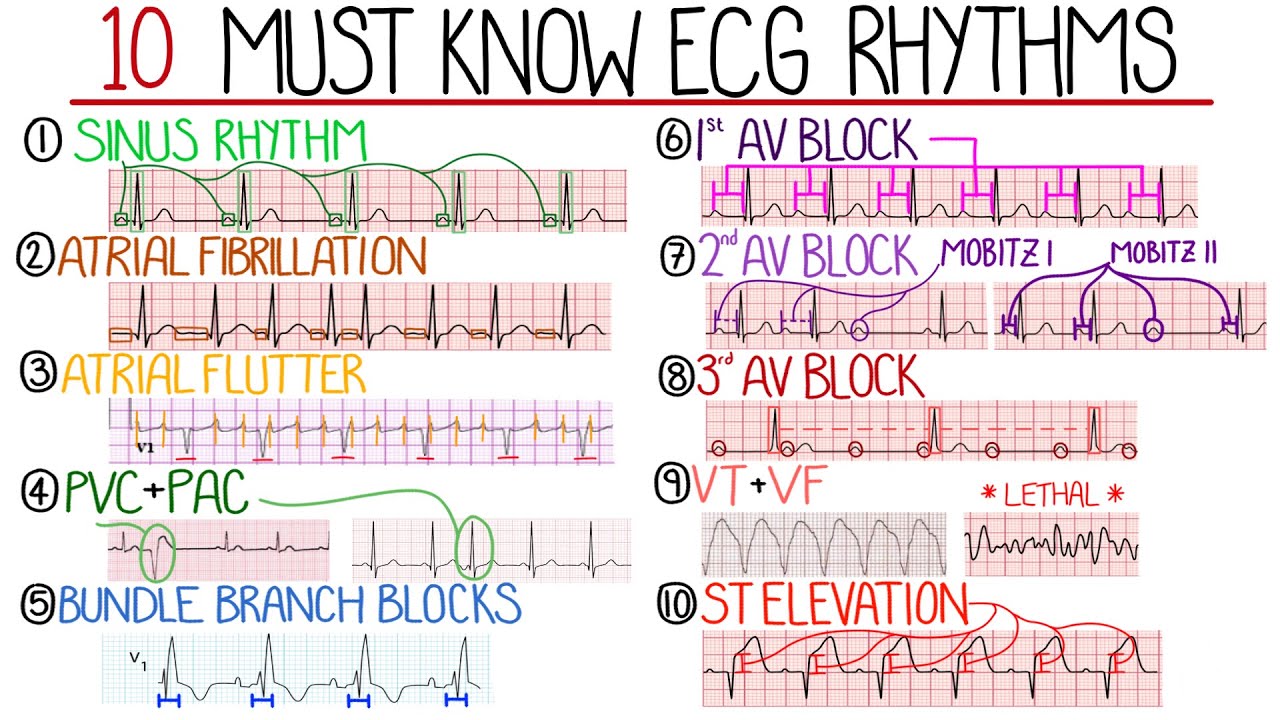
- Sinus rhythm – regular P waves preceding every QRS. It’s the baseline of normality.
- Sinus tachycardia – sinus rhythm with a heart rate above 100 bpm. Often due to fever, pain, or anxiety.
- Sinus bradycardia – rate below 60 bpm; may be normal in athletes or pathological in hypothyroidism.
- Atrial fibrillation – absent distinct P waves, irregular RR intervals. Requires anticoagulation assessment.
- Atrial flutter – saw‑tooth P waves, usually at 250–350 bpm, but the ventricular response can be variable.
- Ventricular tachycardia – wide QRS complexes with a rate above 120 bpm; can be life‑threatening.
- Premature ventricular contraction (PVC) – early, wide QRS without a preceding P wave. Often benign but may signal underlying disease.
- Bundle branch block – wide QRS with characteristic shape (right or left). It alters ventricular depolarization timing.
Interpreting Axis Deviations
The heart’s electrical axis—essentially the direction of its overall electrical flow—can be measured using the frontal plane leads (I, II, aVF). Deviations from the normal 0–+90 degrees can indicate:
- Left axis deviation – often due to left ventricular hypertrophy or left bundle branch block.
- Right axis deviation – can arise from right ventricular hypertrophy or pulmonary hypertension.
- Extreme axis deviation – may signal a more serious conduction disturbance.
Practical Tips for Quick Decoding
Even seasoned cardiologists rely on systematic steps to avoid oversight:
- Start with rate and rhythm. If the rhythm is irregular, identify the cause before moving to wave morphology.
- Check axis early. A deranged axis can hint at a large underlying problem.
- Use the 12‑lead method: leads I, II, III, aVR, aVL, aVF, V1–V6. Each lead offers a different view of the heart.
- Apply the Sokolow–Lyon criteria to assess left ventricular hypertrophy: S in V1 + R in V5/V6 > 35 mm.
- When in doubt, compare with a prior ECG. Sudden changes often matter more than absolute values.
Resources for Deepening Your Knowledge
Building fluency in ECG terminology is an ongoing journey. Consider the following tools:
- Textbooks: “Rapid Interpretation of EKG's” by Dr. Dale Dubin is a staple for quick reference.
- Online courses: The American Heart Association offers free modules covering ECG basics to advanced interpretation.
- Apps: “ECG Quiz” and “CardioLearn” provide interactive case studies and flashcards.
- Mentorship: Pairing with an experienced cardiologist for case reviews accelerates learning.
FAQ
What is the significance of a prolonged PR interval?
A prolonged PR interval indicates delayed conduction through the AV node, often seen in first-degree heart block. While it is usually benign, it can be a marker for underlying conduction system disease.
How can I remember the difference between atrial flutter and fibrillation?
Think of flutter as a regular saw‑tooth pattern (like the edges of a saw), whereas fibrillation is chaotic and irregular, lacking clear, consistent waves.
Is a PVC always a warning sign?
Not necessarily. Many healthy individuals experience occasional PVCs without any underlying heart disease. However, frequent PVCs or associated symptoms warrant further