Find Your Financial Sweet Spot: Mastering Break‑Even Analysis
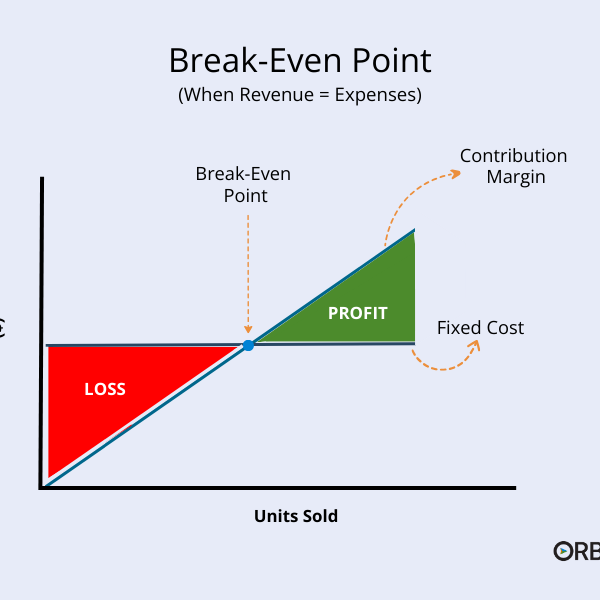
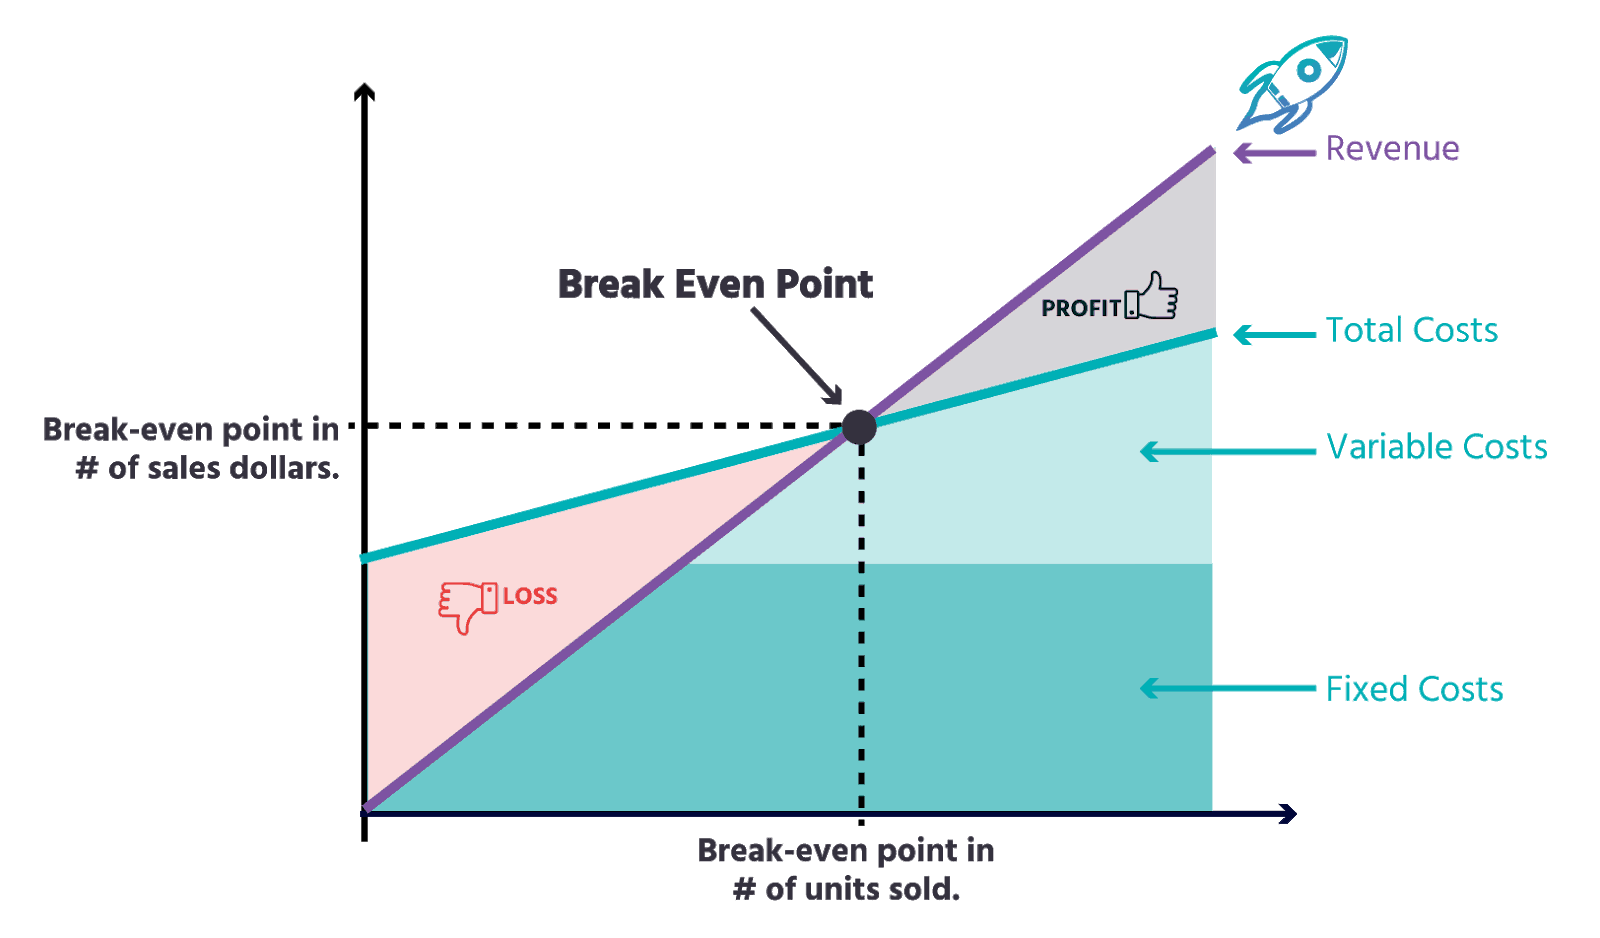
Knowing when your business starts turning a profit is more than a number—it’s the moment you feel your venture truly thrives. That turning point is the break‑even point, the exact spot where total revenue equals total costs. Understanding how to calculate this sweet spot can save you time, money, and stress, giving you a clear target for pricing, sales volume, and budgeting.
Understanding Break‑Even Analysis: The Core of Your Sweet Spot
Break‑even analysis is a straightforward, yet powerful tool that breaks down the relationship between costs, volume, and profit. At its heart, it answers the simple question: How many units do I need to sell to cover every penny I've invested? The answer informs pricing strategies, helps evaluate new product launches, and serves as a benchmark for financial health.
Key Components of the Formula
- Fixed Costs: Expenses that stay the same regardless of sales—rent, salaries, insurance.
- Variable Costs per Unit: Costs that change with each item sold—materials, direct labor, shipping.
- Unit Selling Price: What customers pay for each unit.
The classic break‑even formula looks like this:
Break‑Even Quantity = Fixed Costs ÷ (Unit Price – Variable Cost)
By plugging in the numbers, you get the exact volume needed to stop losing money.
Translating the Math into Business Insight
Once you have the break‑even quantity, two follow‑up questions arise:
- What margin do I need to target above that point? Aiming for a 20% margin, for example, tells you how many units beyond break‑even will secure the desired profit.
- What if costs or prices shift? Sensitivity analysis—adjusting each variable—helps anticipate impacts from raw‑material price hikes or discounting.
Step‑by‑Step Guide to Calculating Your Sweet Spot
Let’s walk through a concrete example. Imagine a startup that sells custom t‑shirts.
Step 1: Gather Your Numbers
- Fixed Costs: $3,000/month (rent, utilities, base salaries)
- Variable Cost per Shirt: $8 (fabric, printing, labor)
- Price per Shirt: $25
Step 2: Apply the Formula
Break‑Even Quantity = 3,000 ÷ (25 – 8) = 3,000 ÷ 17 ≈ 176 shirts per month.
So, the shop needs to sell about 176 shirts each month to cover all costs.
Step 3: Convert Units to Time or Revenue
If the store expects a 20‑hour workweek, that’s roughly 9 shirts per hour. Alternatively, you can calculate the break‑even revenue: 176 × $25 = $4,400.
Using Break‑Even Insight to Shape Strategy
Knowing the break‑even point unlocks several tactical moves.
Pricing Adjustments
- If you can’t hit the volume target, consider a higher price or bundled offers.
- Conversely, a lower price could increase volume, but only if the margin remains positive.
Cost Reduction Opportunities
- Negotiate supplier discounts to lower variable costs.
- Automate portions of production to reduce labor costs.
- Outsource non‑core services to cut fixed overhead.
Revenue Diversification
Adding complementary products or services can push sales volumes past the break‑even threshold more quickly.
Common Pitfalls and How to Avoid Them
Even seasoned entrepreneurs sometimes misread break‑even numbers.
- Ignoring Semi‑Fixed Costs: Utilities or subscription fees that grow with activity can sneak into fixed costs.
- Overlooking Seasonality: A single monthly snapshot may not capture fluctuating demand.
- Using Outdated Data: Prices and costs can shift—review the analysis quarterly.
Tools That Simplify the Calculations
While you can do break‑even analysis in a spreadsheet, many platforms now streamline the process.
- Google Sheets or Microsoft Excel with built‑in templates.
- Accounting software like QuickBooks or Xero offers built‑in break‑even dashboards.
- Dedicated business calculators on sites such as Calculator.net or BizPlanBuilder provide instant results.
Real‑World Success Stories
Take the example of a boutique coffee shop that increased its monthly revenue by 15% after a break‑even review. By renegotiating supplier contracts and launching a loyalty program that boosted repeat customers, the shop moved from a 5% margin to a solid 12% profit margin, all while staying well above its break‑even point.
Frequently Asked Questions
Q: How often should I recalculate my break‑even point?
A: Ideally at least once a quarter, especially if you’ve had major cost changes or new products.
Q: Can I use break‑even analysis for services that don’t have a fixed unit?
A: Yes—redefine the “unit” as a billable hour or project, then apply the same formula with hourly rates and variable expenses.
Q: What if my fixed costs are higher than my potential revenue?
A: In that case, consider reducing fixed overhead, scaling back operations, or exploring alternative revenue streams before expanding further.
By keeping a close eye on your break‑even numbers, you maintain a clear sense of where your business sits financially and can navigate toward sustainable growth with confidence.