How to Calculate Injury Frequency Rate: A Step‑by‑Step Guide
Understanding Injury Frequency Rate
Before you can dive into the numbers, it helps to know what the injury frequency rate actually measures. In simple terms, it quantifies how often work‑related injuries occur relative to the amount of work performed, usually expressed per million hours worked. This metric gives safety professionals a clear picture of risk exposure without getting lost in raw incident counts.
Why Injury Frequency Rate Calculation Is Crucial
Companies that track the injury frequency rate can spot trends before they become costly problems. A rising rate often flags gaps in training, equipment, or procedures, while a steady decline suggests that safety initiatives are paying off. In many industries, regulators also require this figure, so accurate calculation keeps you compliant and credible.
The Core Formula Explained
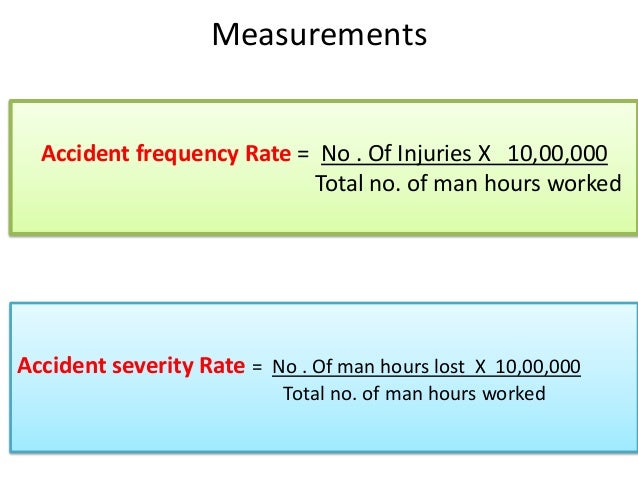
At the heart of injury frequency rate calculation lies a straightforward equation:
- IFR = (Number of Recordable Injuries × 1,000,000) ÷ Total Hours Worked
The multiplier (one million) standardizes the rate, making it comparable across organizations of different sizes. “Recordable injuries” typically follow the criteria set by the Occupational Safety and Health Administration (OSHA) or the equivalent body in your region.
Gathering the Data You Need
Accurate numbers start with reliable data. Pull the following from your safety management system:
- Count of recordable injuries for the reporting period (often a calendar year).
- Total hours worked by all employees, contractors, and temporary staff during the same period.
If you have multiple work sites, aggregate the hours before plugging them into the formula. Remember that overtime, shift differentials, and part‑time hours all count toward the total.
Step‑by‑Step Calculation Process
Let’s walk through a practical example. Suppose your company logged 12 recordable injuries over the past year, and the combined work hours amounted to 3,250,000.
- Multiply injuries by 1,000,000: 12 × 1,000,000 = 12,000,000.
- Divide by total hours: 12,000,000 ÷ 3,250,000 ≈ 3.69.
The resulting injury frequency rate is 3.69 injuries per million hours worked. You can now compare this figure to industry benchmarks or your own historical data to assess performance.
Adjusting for Different Reporting Periods
If you’re looking at a quarterly or monthly snapshot, the same formula applies—but you’ll need to scale the hours accordingly. For a three‑month window, simply use the hours worked during those three months. Some organizations also calculate a rolling 12‑month IFR to smooth out seasonal fluctuations.
Common Pitfalls and How to Avoid Them
Even seasoned safety managers can slip up. Here are a few mistakes that skew the metric:
- Excluding non‑recordable injuries. While only recordable cases count for the official rate, ignoring near‑misses can hide emerging hazards.
- Mismatching time frames. Ensure the injury count and total hours cover the exact same period; otherwise the ratio becomes meaningless.
- Double‑counting hours. When consolidating data from multiple payroll systems, verify that each hour is counted only once.
Double‑check your sources before you finalize the calculation, and keep a log of any adjustments for audit purposes.
Interpreting the Results
An IFR of 3.69, as in our example, might be low for high‑risk construction but high for a clerical office environment. Context matters. Benchmark against similar firms, consider the nature of the work, and look for patterns—such as a particular department consistently posting higher rates.
Using the Metric to Drive Improvements
Once you have a reliable injury frequency rate, turn it into action. Some practical steps include:
- Targeted safety training for crews with elevated rates.
- Equipment inspections focused on the most common injury mechanisms.
- Root‑cause analysis of each recordable incident to uncover systemic issues.
Track the IFR after each intervention to see if the number moves in the right direction. Over time, a downward trend becomes tangible proof that your safety program works.
FAQ
What distinguishes injury frequency rate from lost‑time injury rate? The injury frequency rate counts all recordable injuries, regardless of time lost, while the lost‑time injury rate includes only incidents that caused workers to miss at least one full workday.
Can I use the same formula for multiple locations? Yes, but calculate an IFR for each site first, then aggregate the numbers if you need an overall corporate rate. Separate site‑specific rates help pinpoint problem areas.
How often should I recalculate the injury frequency rate? Many organizations update it monthly for internal monitoring, but a formal report is typically generated annually for regulatory compliance.
Is it acceptable to round the final IFR? Rounding to two decimal places is standard practice and makes the figure easier to communicate without sacrificing accuracy.