How to Get Started with Google Earth Engine: A Beginner’s Guide
What Is Google Earth Engine?
Google Earth Engine (GEE) is a cloud‑based platform that lets anyone tap into petabytes of satellite imagery, climate data, and computational power without installing specialized software. It blends a massive public data archive with a JavaScript‑styled scripting environment, so you can write, test, and share analyses directly in your web browser. In short, GEE turns a daunting collection of raw pixels into actionable insights—whether you’re mapping deforestation, monitoring urban growth, or exploring water quality.
Why Use Earth Engine for Remote Sensing?
Traditional GIS workflows often require downloading gigabytes of data, cleaning it on a local machine, and then processing it step by step. With Earth Engine, the heavy lifting happens on Google’s servers, meaning you can run complex algorithms on the entire planet in minutes. The platform also offers built‑in time‑series functions, which are perfect for detecting trends across years of data. For beginners, the biggest advantage is the “no‑install” barrier: a browser tab and a free account are all you need to begin.
Setting Up Your First Account
Getting started is a matter of a few clicks. Visit the Google Earth Engine homepage, click “Sign up,” and fill out the short form describing your affiliation and intended use. Approval usually arrives within a day; if you’re a student or researcher, you can speed the process by attaching a brief project description. Once approved, log in and you’ll be taken to the Earth Engine Code Editor—a sleek interface where you’ll write, run, and visualize scripts.
Exploring the Code Editor
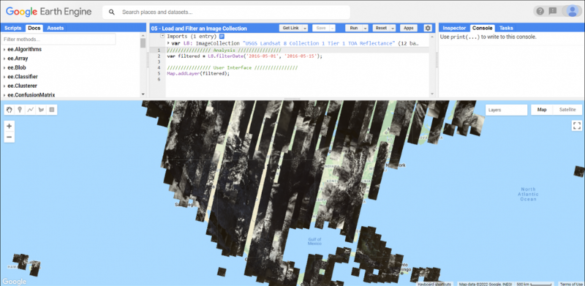
The Code Editor is split into three panels: a script window on the left, a map view in the center, and a console at the bottom. The script window supports JavaScript syntax and provides autocomplete for Earth Engine objects, which helps avoid spelling errors. The map view instantly renders the results of your script, while the console shows printed messages, error traces, and any data you explicitly export. Familiarizing yourself with these panels saves a lot of head‑scratching later on.
Running a Simple Land‑Cover Example
Let’s walk through a classic “hello world” for remote sensing: visualizing global forest cover. First, import a dataset—here we use the MODIS Vegetation Continuous Fields collection.
var modis = ee.ImageCollection('MODIS/006/MOD44B').filterDate('2020-01-01', '2020-12-31')
.first();
Next, select the “Tree_Cover” band and clip it to a region of interest (for example, the Amazon basin).
var amazon = ee.Geometry.Rectangle([-74, -15, -50, 5]);var forest = modis.select('Percent_Tree_Cover').clip(amazon);
Map.centerObject(amazon, 5);
Map.addLayer(forest, {min:0, max:100, palette:['white','green']}, 'Tree Cover 2020');
When you hit “Run,” the map updates with a green‑shaded overlay showing where trees dominate the landscape. This tiny script demonstrates the core workflow: load data, filter by date, select a band, mask to an area, and finally visualize.
Tips for Managing Scripts and Data
As you accumulate more scripts, keep them organized in folders within the Code Editor. Naming conventions—like landcover_2020_forest.js—make it easy to locate a specific workflow later. If you plan to share your analysis, use the “Export” button to generate a public URL or link it directly to a Google Drive folder. Remember that Earth Engine enforces usage quotas; batching large exports or running many heavy computations in a short window can trigger limits, so stagger your jobs when possible.
Common Pitfalls and How to Avoid Them
One frequent stumbling block is forgetting to cast geometry objects to the correct projection. Earth Engine defaults to the WGS84 coordinate system, but many satellite collections use different native projections. To sidestep misaligned layers, explicitly set the projection when you reproject an image: image.reproject('EPSG:4326'). Another issue is assuming that a dataset is up‑to‑date; always check the “last updated” field in the Data Catalog, especially for rapidly changing products like Sentinel‑2 Level‑2A.
Next Steps: Where to Learn More
Once you’ve mastered the basics, the official Earth Engine Developer Guide offers deeper dives into topics such as machine‑learning classification, time‑series analysis, and custom UI widgets. Community forums—particularly the Earth Engine Users Group on Google Groups—are gold mines for troubleshooting and discovering novel datasets. Finally, consider enrolling in a short online course; many universities now offer free modules that walk you through real‑world case studies, from wildfire risk mapping to coastal erosion monitoring.
FAQ
- Do I need a paid Google account to use Earth Engine? No. A standard free Google account is sufficient for most educational and research purposes, though commercial users may need a paid license.
- Can I process data offline after exporting it? Yes. You can export images or tables to Google Drive or Cloud Storage, then download them for offline analysis in QGIS, Python, or R.
- What programming languages does Earth Engine support? The web interface uses JavaScript, but you can also run Python scripts via the Earth Engine Python API on your local machine or in Colab notebooks.
- Is there a limit to how much data I can analyze? Earth Engine imposes daily quotas on computation and storage, but these limits are generous for most beginner projects. If you hit a ceiling, you can request higher quota through the Google Cloud Console.