How to Master TradingView Candlestick Indicators for Beginners
What Are Candlestick Indicators on TradingView?
When you open a chart on TradingView, the colorful bars you see are more than just price history—they’re a visual language. Candlestick indicators translate that language into patterns that can hint at market psychology, momentum, and potential reversals. For a newcomer, the idea of dozens of “dojis,” “engulfing” shapes, or “hammer” formations can feel overwhelming. The good news is that TradingView bundles many of these classic patterns into ready‑to‑use indicators, so you don’t have to sketch them by hand.
Why Use Built‑In Indicators Instead of Manual Drawing?
- Speed. One click adds the pattern to every candle on the chart.
- Consistency. The algorithm applies the same rules across time frames, eliminating personal bias.
- Automation. You can pair indicators with alerts, so your phone pings when a bullish engulfing appears.
That said, relying solely on a pop‑up label can breed complacency. Understanding what each pattern means keeps you from treating a “signal” as a guarantee.
Getting Started: Adding a Candlestick Indicator
1. Open any chart and click the Indicators button (the little flask icon) at the top.
2. Type “candlestick” in the search box. You’ll see options like “Candlestick Patterns,” “Bullish Engulfing,” and “Hammer.”
3. Click the one you want, and TradingView instantly overlays symbols on matching candles.
Most beginners start with the all‑in‑one “Candlestick Patterns” script, which flags a variety of classic formations. From there, you can add more specific tools as you get comfortable.
Key Patterns Every Beginner Should Recognize
While the indicator will draw arrows or icons, knowing the story behind each shape helps you decide whether to act.
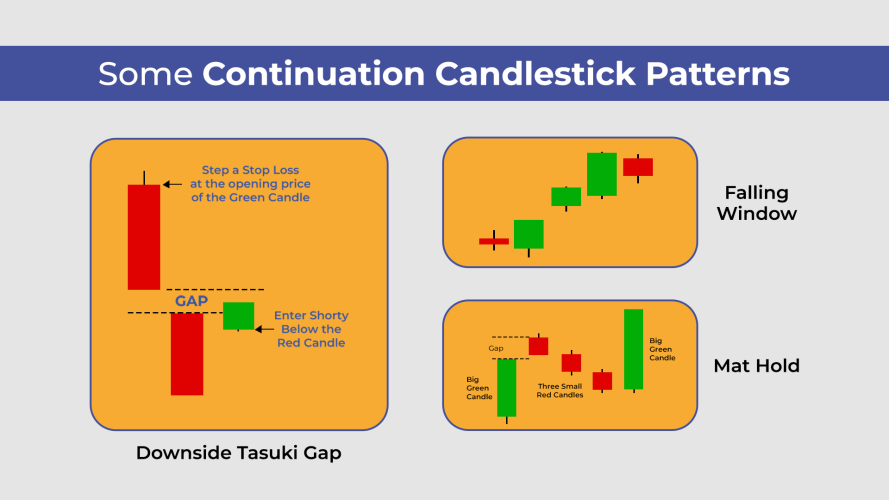
- Doji. A candle with almost equal open and close, signaling indecision. Look for a follow‑up candle that confirms direction.
- Hammer & Shooting Star. Both have long lower or upper shadows, respectively, indicating a possible reversal after a trend.
- Engulfing. A small candle is completely “swallowed” by the next larger opposite‑color candle—often a strong reversal clue.
- Morning Star / Evening Star. A three‑candle formation that marks a shift from downtrend to uptrend (or vice versa).
Remember, no single pattern works on every market. Context—like the prevailing trend and support/resistance levels—still matters.
Customizing Indicator Settings for Better Fit
Every trader has a preferred time frame and risk tolerance, and TradingView lets you tweak a lot of the defaults.
- Look‑back period. Some scripts let you define how many candles to scan for a pattern, which can reduce noise on lower time frames.
- Alert thresholds. You can set alerts only for bullish patterns, only for bearish, or for both, depending on your strategy.
- Visual style. Change the color of the icons or add text labels to make the signals stand out against your chart’s background.
Experiment on a demo account first; a subtle change—like increasing the look‑back from 5 to 10 candles—might dramatically cut down false positives.
Combining Candlestick Indicators with Other Tools
Indicators shine brightest when they complement, not replace, other analysis methods. Here are a few common pairings:
- Moving averages. If a bullish engulfing appears while price is above the 20‑period MA, the trade‑off chance improves.
- Volume spikes. A hammer on low volume may be weak, but the same hammer with a surge in volume suggests stronger conviction.
- Support / resistance zones. Patterns forming near a well‑tested level often have higher reliability.
By stacking these clues, you create a more robust decision‑making framework rather than chasing a single, isolated signal.
Setting Up Alerts to Stay Ahead of the Curve
One of TradingView’s biggest advantages is its alert engine. After you add a candlestick indicator, right‑click the icon that appears on the chart and select “Add Alert.” Choose whether you want an email, SMS, or push notification. You can even add a custom message like “Bullish Engulfing on EUR/USD – consider entry.” This way, you don’t have to stare at the screen all day; the platform does the watching for you.
Common Mistakes to Avoid
Over‑reliance on a single pattern. A bearish engulfing on a strong uptrend may just be a short‑term pullback. Always check the broader context.
Ignoring market type. Forex, equities, and crypto each have distinct volatility profiles. A pattern that works well in a low‑volatility stock might generate many false signals in a crypto market.
Setting alerts on every candle. Too many notifications can lead to alert fatigue, causing you to miss the truly important moves.
Practice Makes Perfect: A Simple Workflow
1. Open a 1‑hour chart of a liquid asset (e.g., EUR/USD).
2. Add the “Candlestick Patterns” indicator.
3. Enable alerts for bullish patterns only.
4. Wait for a pattern that aligns with a nearby support level and a rising 20‑MA.
5. Record the outcome in a trade journal—note entry, stop, target, and whether the pattern held.
Repeating this routine for a few weeks lets you gauge which patterns actually add value to your trading style.
FAQ
Do I need a paid TradingView plan to use candlestick indicators?
No. The basic free tier includes the standard “Candlestick Patterns” script and the ability to set alerts, though the number of simultaneous alerts is limited.
Can I create my own custom candlestick indicator?
Absolutely. TradingView’s Pine Script language lets you define the exact criteria for a pattern and then apply it across any chart. Many community scripts are already shared in the public library.
How reliable are candlestick signals on lower time frames?
Generally less reliable. Shorter time frames contain more market “noise,” so it’s wise to combine patterns with volume or momentum filters when trading on 5‑minute charts.