How to Read a North Carolina Radar Map for Real‑Time Weather
When a storm rolls across the Tar Heel State, the quickest way to see what’s happening is a North Carolina radar map. Whether you’re planning a weekend hike, watching a baseball game, or simply wondering if that thunderhead will reach your backyard, the map turns raw radar data into a visual snapshot you can read at a glance.
What a Radar Map Shows
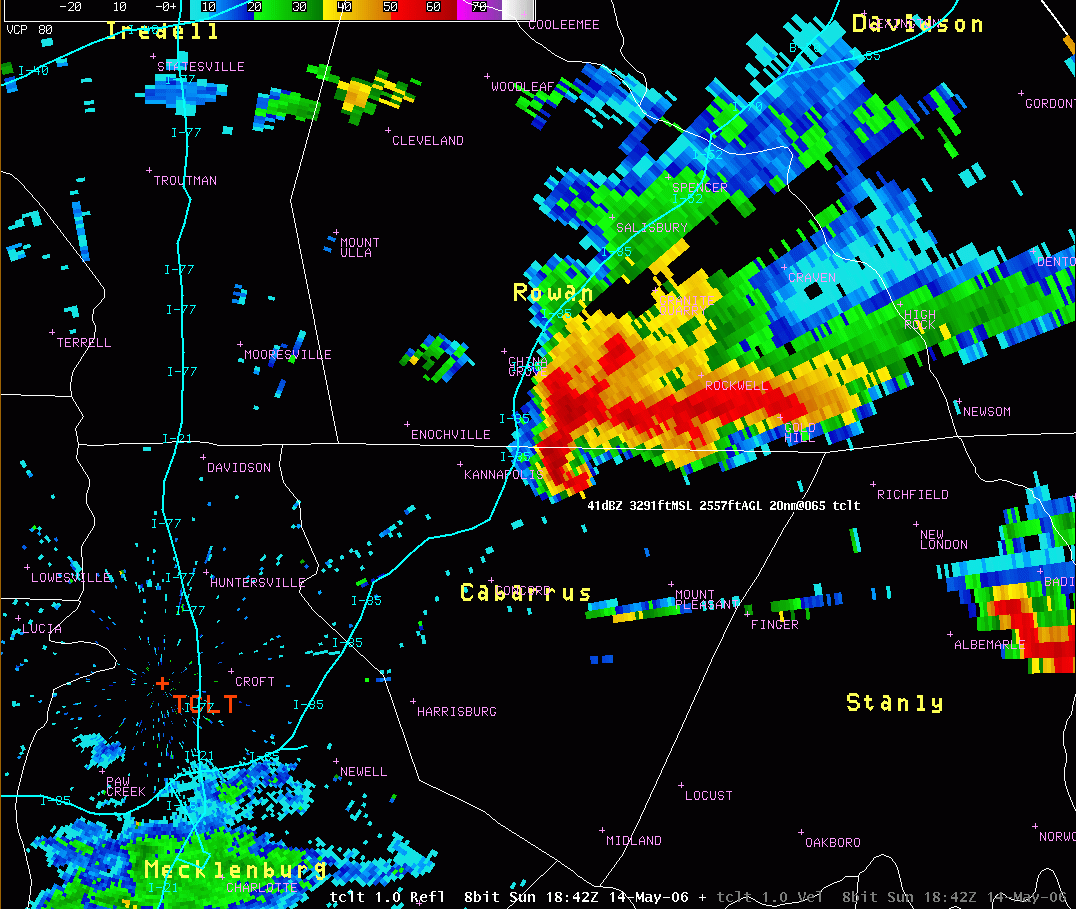
Radar works by sending out a pulse of microwave energy and listening for the echo that bounces back from raindrops, hail, or snowflakes. The strength of that echo, called reflectivity, is what you see as colored blobs on the screen. Light greens usually mean light rain, while deep reds and purples indicate heavy downpours or hail.
Most NC radar maps also overlay velocity data, often displayed as small arrows. Those arrows point in the direction the precipitation is moving and their color (typically blue for toward the radar, red for away) hints at wind speed. Together, reflectivity and velocity give a surprisingly detailed picture of a storm’s structure.
Finding a Reliable NC Radar Map Online
- National Weather Service (NWS) – The official source, offering a free, continuously updated map with customizable layers.
- Weather.com – User‑friendly interface, plus short‑term forecasts tied to the radar display.
- AccuWeather – Offers a “Radar+” view that includes lightning strikes and precipitation type.
- Local TV stations – Many North Carolina stations host their own radar pages, often with community‑specific alerts.
All of these sites let you zoom in on a county, adjust the time loop, and toggle between radar‑only and radar‑plus‑satellite views. Pick the one that feels most intuitive for your routine.
Interpreting the Colors and Animations
Color scales differ slightly between providers, but the general rule holds: cooler colors equal lighter precipitation, warmer colors equal heavier. A quick tip is to watch the animation. If a red blob is expanding rapidly, expect intense rain or possible flash flooding within the next hour. Conversely, a fading green patch suggests the rain is tapering off.
Many maps also include a “storm‑track” line that projects the current motion a few minutes into the future. It’s not a guarantee, but it’s handy for short‑term decisions, especially if you’re on the road.
Using the Map for Personal Planning
Outdoor enthusiasts can match the radar’s timing to their activity schedule. For example, a morning cyclist in Asheville might check the map at 6 a.m. to see if a fast‑moving line of showers will pass before noon.
Travelers crossing the state benefit from the radar’s ability to reveal “rain shadows”—areas where the storm has already moved on, leaving clear skies behind. That can be a lifesaver when you’re trying to avoid a traffic jam caused by sudden downpours on the I‑40 corridor.
Common Misunderstandings
One frequent misconception is that radar shows the exact amount of rain that will fall on a specific spot. In reality, the echo measures how much precipitation is in the air column, not how much will reach the ground at any given point.
Another limitation is range. Most NEXRAD radars, the ones feeding NC maps, have a maximum range of about 250 miles. Anything beyond that appears as a blurry edge or not at all, which can be confusing when storms approach from the ocean.
Tips for Getting the Most Accurate Snapshot
- Refresh every 5‑10 minutes. The most up‑to‑date loops are usually labeled “latest” or “nowcast.”
- Zoom in to your county, but keep an eye on the surrounding area. Storms can develop quickly and travel farther than the map’s immediate view.
- Combine radar with local forecasts. Radar shows what’s happening now; forecasts tell you what to expect in the next 12‑24 hours.
- Enable “storm‑track” or “motion vector” layers if you need to anticipate where a thunderstorm will head next.
FAQ
What’s the difference between a reflectivity and a precipitation‑type radar map?
Reflectivity maps display the intensity of the echo, using colors to represent rain rate. Precipitation‑type maps add an extra layer that distinguishes rain from snow or sleet, often by changing the hue or pattern of the colors.
Can I rely on the radar to predict tornadoes?
Radar can reveal rotation signatures, called velocity couplets, which are a warning sign for tornado development. However, only trained meteorologists should issue tornado warnings; the map alone isn’t enough for the average viewer.
Why does the radar sometimes show a “hole” in the middle of a storm?
That’s usually ground clutter—reflections from buildings or terrain that the radar filters out. The algorithm removes those echoes, leaving a clear‑spot that looks like a hole, even though the rain is still present.