How to Supercharge Trading with the Supertrend & 200‑EMA Strategy
If you’ve been hunting for a systematic edge that feels both simple and robust, the Supertrend 200 EMA strategy might be worth a closer look. By pairing a trend‑following indicator (Supertrend) with a long‑term moving average (200‑day EMA), traders aim to capture big moves while filtering out a lot of market noise. Below we walk through the logic behind the combo, practical rules for entries and exits, and a few cautionary notes to keep your risk in check.
Why the Supertrend 200 EMA Strategy works
The Supertrend indicator reacts quickly to price changes, essentially turning a volatility‑adjusted ATR (Average True Range) into a trailing stop‑line that flips color when the market changes direction. The 200‑day EMA, on the other hand, is a smooth line that reflects the longer‑term bias of the asset. When the Supertrend sits on the same side of the 200 EMA, the market is usually in a strong, unified direction, which is the sweet spot for the strategy.
Setting up the chart
Start with a daily chart of the instrument you trade—stocks, forex pairs, or crypto all work. Add the 200‑day EMA in a medium‑weight color, then overlay the Supertrend with default parameters (often 10‑period ATR and a multiplier of 3). You can adjust the ATR settings for more or less sensitivity, but the classic values strike a decent balance for most liquid markets.
Entry rules
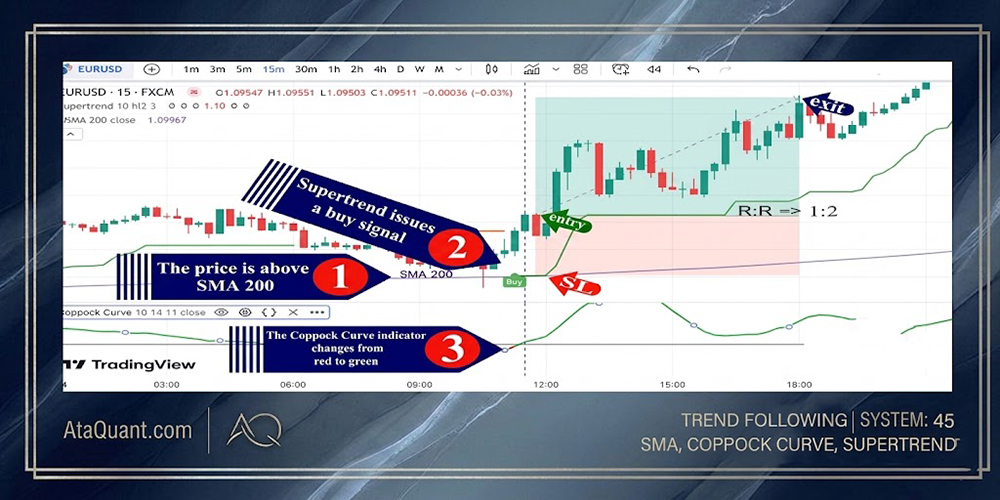
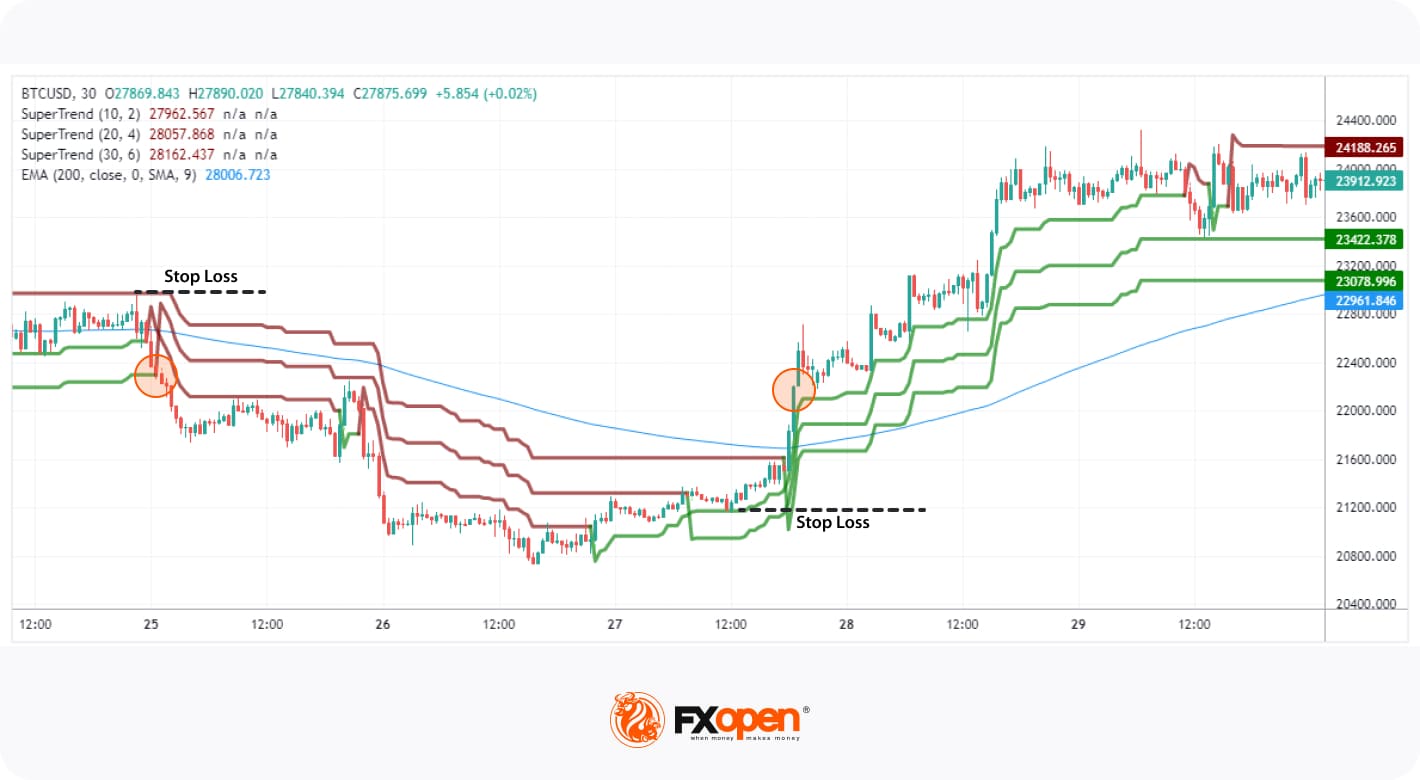
- Look for the Supertrend line to be green (bullish) and the price to be above the 200 EMA. This is a “buy” signal.
- Conversely, a red Supertrend line with price below the 200 EMA signals a “sell” or short entry.
- Enter at the close of the candle that confirms the alignment, not on the first tick of the breakout. This reduces the chance of getting whipsawed by a false move.
Exit and stop‑loss guidelines
- Place an initial stop‑loss a few ATR values below the Supertrend line for longs (above for shorts). This gives the trade room to breathe while respecting the volatility‑based nature of the indicator.
- Consider trailing the stop to the Supertrend line itself as the trade progresses. When the line flips, it often coincides with a genuine reversal.
- Optionally, set a profit target at a multiple of the risk (e.g., 2× or 3×). Many traders find that letting the trade run until the Supertrend flips yields better returns than a rigid target.
Risk management basics
Even a well‑designed system can produce a string of losses. Most practitioners recommend risking no more than 1‑2 % of the account on any single trade. To calculate position size, measure the distance between entry price and the stop‑loss, then scale the lot size so that the dollar risk stays within your chosen limit.
Backtesting insights
When you run the Supertrend 200 EMA strategy on historical data, you’ll typically see a decent win‑rate—often around 55‑60 %—with an average reward‑to‑risk ratio above 1.5. Those numbers aren’t guarantees, but they suggest the combo can be profitable over many market cycles, especially when you stay disciplined with stops.
Adapting to different markets
In fast‑moving crypto markets, you might tighten the ATR multiplier to 2 to react quicker. For slower‑moving equities, keeping the default 3 or even bumping it to 4 can help avoid premature exits. The key is to test a few variations on the specific asset class you trade.
Common pitfalls to avoid
- Relying on the signal alone without confirming the broader market context (e.g., major economic news or earnings releases).
- Using overly tight stops that ignore the volatility the Supertrend is built to measure.
- Applying the system on low‑liquidity assets where the EMA can lag dramatically.
Enhancing the strategy with filters
Many traders layer a simple momentum filter, such as a 14‑period RSI, to weed out overbought or oversold conditions before taking a trade. For instance, you might only go long when the RSI is above 50, and only short when it’s below 50. This extra step can improve the edge without adding much complexity.
Psychology: staying calm when the market tests you
The Supertrend 200 EMA strategy can produce a few false flips, especially in choppy sideways periods. Accepting that a few trades will fail is part of the game. Stick to your predefined stop‑losses, avoid the urge to “average down,” and trust the statistical advantage over many trades.
Putting it all together: a sample trade walk‑through
Imagine EUR/USD on a daily chart. The price has been above the 200 EMA for several weeks, and the Supertrend line is green. On Day 12, the candle closes above both the EMA and the Supertrend, confirming the bullish alignment. You enter a long position, set the stop‑loss 1.5 × ATR below the Supertrend line, and let the trade run. Over the next 20 days, the Supertrend stays green, the price climbs, and the stop trails upward. When the Supertrend finally flips red, you exit, locking in a sizable gain.
When to stay out
Periods of low volatility—often seen after major central‑bank announcements—can cause the Supertrend to wobble, producing many false signals. If the ATR is unusually low, consider pausing the system until the market regains momentum.
Final thoughts on the Supertrend 200 EMA combo
This approach isn’t a magic bullet, but it blends a fast‑reacting trend detector with a long‑term bias filter, delivering a clearer picture of market direction. By honoring disciplined entry, exit, and risk rules, you give the strategy a chance to shine across different asset classes.
Frequently Asked Questions
Q: Can I use the Supertrend 200 EMA strategy on intraday charts?
A: Yes, many traders adapt it to 15‑minute or hourly charts. The principle stays the same—Supertrend must align with the EMA—but you’ll need to tweak the ATR multiplier to suit the tighter time frame.
Q: How often does the Supertrend actually flip?
A: In trending markets, flips may occur once every few weeks or months. In ranging markets, you might see multiple flips per week, which is why it’s wise to avoid the system during low‑volatility phases.
Q: Should I combine this strategy with other indicators?
A: Adding a momentum filter like RSI or MACD can reduce false entries, but the core strength of the method lies in its two‑indicator simplicity. Over‑complicating it can dilute the edge.
Q: Is the 200‑day EMA the only moving average that works?
A: The 200 EMA is popular for its long‑term perspective, but some traders experiment with a 150 EMA or even a 250 EMA. Test alternatives on your preferred market to see which aligns best with the Supertrend’s signals.