How to Use a Standard Deviation Calculator for Risk Analysis
Why Standard Deviation Matters in Risk Assessment
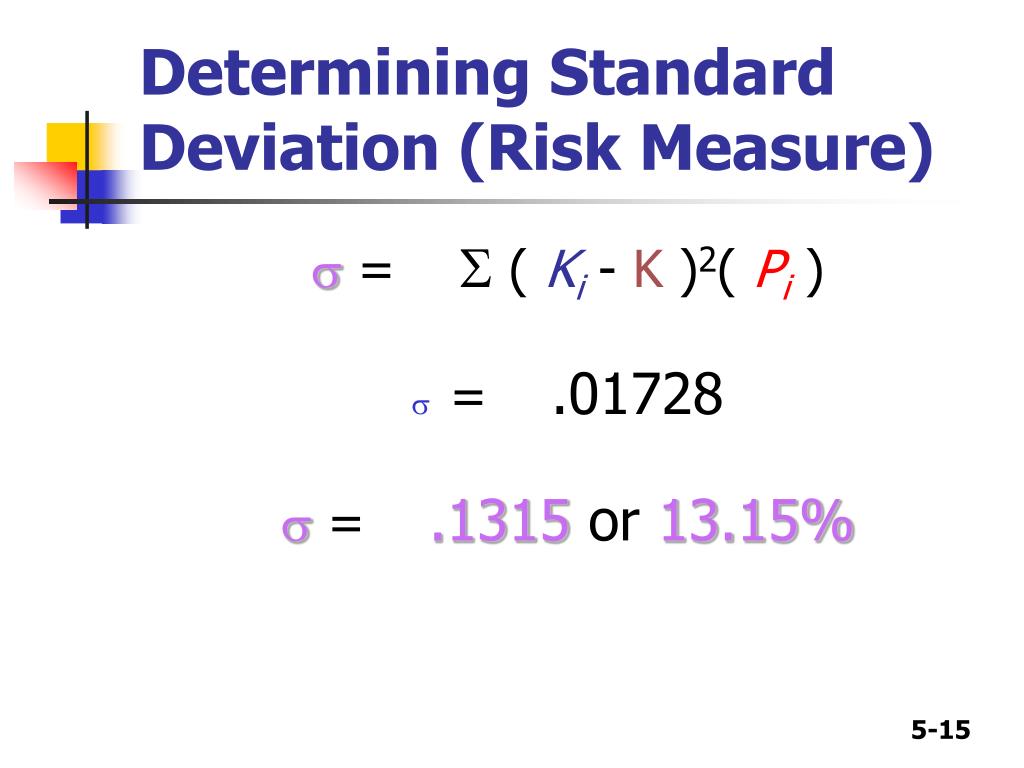
When you’re trying to gauge the uncertainty of an investment, a project timeline, or even a manufacturing process, the spread of possible outcomes is more telling than the average alone. That spread is captured by the standard deviation, a statistical metric that quantifies how far individual data points tend to deviate from the mean. In risk analysis, a larger standard deviation signals higher volatility, meaning the odds of extreme gains or losses increase. Conversely, a low standard deviation suggests a more predictable, stable scenario.
What a Standard Deviation Calculator Does
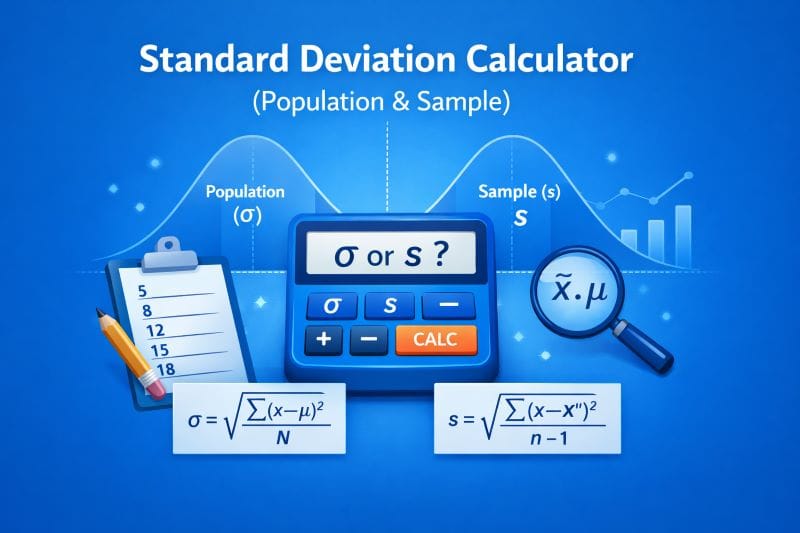
A standard deviation calculator streamlines the math that would otherwise require several manual steps. You feed it a data set—daily returns, defect counts, or any numeric series—and the tool instantly returns the variance, the square root of that variance, and often a confidence interval as well. Most online calculators also let you choose between a sample and a population standard deviation, a distinction that matters when your data represent only a slice of the whole universe you’re studying.
Step‑by‑Step: Running a Risk Analysis with the Calculator
- Gather your data. Pull together the relevant numbers: historical price changes, failure rates, or any metric you’re evaluating.
- Decide on sample vs. population. If your data set is a subset of a larger universe (e.g., ten years of stock returns from a 30‑year history), select “sample.” Use “population” when the data set covers the entire group you care about.
- Enter the figures. Most calculators accept a comma‑separated list or a column paste. Double‑check for stray characters that could skew the result.
- Review the output. You’ll see the standard deviation value, often alongside the mean and variance. Some tools also provide a visual bell curve.
- Interpret the number. Compare the resulting deviation to industry benchmarks or your own risk tolerance. A higher value may prompt you to hedge, diversify, or reconsider the project.
Translating the Result into Actionable Insight
Suppose you’re evaluating two potential investments. Both have an expected return of 8%, but Investment A shows a standard deviation of 4% while Investment B’s deviation sits at 12%. Even though the averages match, the risk profile diverges dramatically. In a risk‑adjusted framework—such as the Sharpe ratio—you’d likely favor Investment A unless you’re explicitly seeking higher upside with the accompanying downside.
In operational settings, a high standard deviation in defect rates might trigger a root‑cause analysis, prompting tighter quality controls. In project management, a wide spread of task completion times could lead you to add contingency buffers or re‑examine resource allocation.
Choosing the Right Calculator for Your Needs
Not all calculators are created equal. Some free web tools are perfect for quick, one‑off analyses, but they may lack advanced features like batch uploads, custom confidence levels, or exportable reports. Enterprise‑grade platforms often integrate directly with data warehouses, allowing you to automate the flow from raw data to risk metrics.
If you work with large data sets, look for calculators that accept spreadsheet uploads (CSV or Excel) and that can handle thousands of rows without timing out. For financial analysts, a calculator that also offers Value at Risk (VaR) or Monte Carlo simulation inputs can save a lot of extra work.
Common Pitfalls and How to Avoid Them
One frequent mistake is treating a sample standard deviation as if it were a population metric, which understates risk when the data set is small. Another trap is ignoring the effect of outliers; a single extreme value can inflate the deviation, making the overall risk appear higher than it truly is. To mitigate this, consider trimming the data or using a robust estimator like the median absolute deviation for preliminary checks.
Lastly, remember that standard deviation assumes a roughly normal (bell‑shaped) distribution. If your data are heavily skewed—common in commodity prices or insurance claims—supplement the standard deviation with other measures such as the interquartile range or conditional VaR.
Quick FAQ
Q: Can I rely solely on standard deviation for risk decisions?
A: It’s a valuable indicator, but it should be part of a broader toolkit that includes scenario analysis, stress testing, and qualitative judgments.
Q: What’s the difference between sample and population standard deviation?
A: Sample standard deviation divides the sum of squared deviations by (n‑1) to correct bias, whereas population standard deviation divides by n, assuming you have data for the entire group.
Q: How often should I recalculate the standard deviation?
A: Frequency depends on data volatility. For fast‑moving markets, daily updates may be warranted; for slower processes, a monthly or quarterly refresh often suffices.
Q: Are there free tools that handle large data sets?
A: Some open‑source libraries (e.g., Python’s NumPy or R’s stats package) can process millions of records efficiently, though they require a bit of coding knowledge.