Integrating Zabbix with Modbus TCP: A Step‑by‑Step Guide
When you need to monitor industrial equipment, sensors, or PLCs, Zabbix’s powerful monitoring framework can talk directly to Modbus TCP devices. This guide walks you through every step—from installing the necessary modules to creating triggers that alert you before a fault becomes critical. By the end, you’ll have a fully functional pipeline that turns raw Modbus data into actionable metrics inside Zabbix.
What Is Modbus TCP and Why Zabbix?
Modbus TCP is a widely adopted protocol for communicating with embedded devices over Ethernet. It exposes registers, coils, and input statuses that can be read or written using a simple request–response format. Zabbix, on the other hand, excels at collecting, visualizing, and alerting on time‑series data. Together, they give you real‑time insight into plant operations, machine health, and process control.
Prerequisites Before You Start
- Operating System – A Linux distribution (Ubuntu, CentOS, Debian) with sudo access.
- Zabbix Server – A running instance of Zabbix Server, Zabbix Frontend, and Zabbix Agent.
- Modbus TCP Device – The IP address, port (default 502), and register map of the equipment.
- Python 3.8+ – Required for the
modbus‑pymodbuslibrary. - Network Access – Ensure the Zabbix Server can reach the device’s IP on the Modbus port.
Step 1: Install the Modbus PHP Agent Extension
Zabbix can natively fetch Modbus data via a PHP agent script. The most common approach is to use the modbus‑pymodbus Python library, wrapped in a simple PHP CLI script that Zabbix calls.
- Install Python and pip:
sudo apt-get update && sudo apt-get install -y python3 python3-pip - Install
pymodbuswith pip:sudo pip3 install pymodbus - Create a directory for scripts:
sudo mkdir /usr/local/lib/zabbix-modbus - Copy the following Python script to
/usr/local/lib/zabbix-modbus/modbus_reader.py:
modbus_reader.py
#!/usr/bin/env python3import sys
from pymodbus.client.sync import ModbusTcpClient
if len(sys.argv) != 5:
sys.exit("Usage: modbus_reader.py host port unit register count")
host, port, unit, register, count = sys.argv[1:6]
client = ModbusTcpClient(host, port=int(port))
result = client.read_holding_registers(int(register), int(count), unit=int(unit))
client.close()
if result.isError():
sys.exit("ERROR: " + str(result))
print(result.registers)
- Make the script executable:
sudo chmod +x /usr/local/lib/zabbix-modbus/modbus_reader.py - Create a PHP wrapper to call the script. Place this file as
/usr/share/zabbix/externalscripts/modbus.php:
modbus.php
#!/usr/bin/phpif ($argc !== 6) {
exit("Usage: modbus.php host port unit register count\n");
}
$host = escapeshellarg($argv[1]);
$port = escapeshellarg($argv[2]);
$unit = escapeshellarg($argv[3]);
$register = escapeshellarg($argv[4]);
$count = escapeshellarg($argv[5]);
$cmd = "/usr/local/lib/zabbix-modbus/modbus_reader.py $host $port $unit $register $count";
$output = shell_exec($cmd);
echo $output . PHP_EOL;
?>
- Make the PHP script executable:
sudo chmod +x /usr/share/zabbix/externalscripts/modbus.php
Step 2: Configure Zabbix Items to Read Modbus Registers
Log into the Zabbix frontend and navigate to Configuration → Hosts. Create a host representing your Modbus device (e.g., “PLC‑01”). Under the Items tab, add a new item:
- Name: Temperature Sensor (Holding Register)
- Type: External check
- Key: modbus.php[IP,502,1,Register,Count]
- Type of Information: Numeric (unsigned)
- Update Interval: 60s
- Applications: Sensors
Replace IP with the device’s address, Register with the address of the temperature sensor, and Count with the number of registers to read (usually 1).
Step 3: Transform Raw Register Values
Many Modbus devices encode floating‑point numbers or scaled integers. Use Zabbix user parameters or preprocessing steps:
- Preprocessing → JSON Path to parse the list output (e.g.,
$[0]for the first register). - Preprocessing → Arithmetic to apply scaling:
value * 0.1if the register is stored as a tenth‑degree integer.
Step 4: Create Triggers for Alerting
Set up triggers to watch for abnormal values:
- Trigger Name: High Temperature on PLC‑01
- Expression:
{PLC-01:modbus.php[IP,502,1,Register,1].last()}>80 - Severity: Warning
Repeat similar steps for other sensors like voltage, current, or status bits. If your device reports booleans, use .last() compared to 1 or 0.
Step 5: Visualize Data on Dashboards
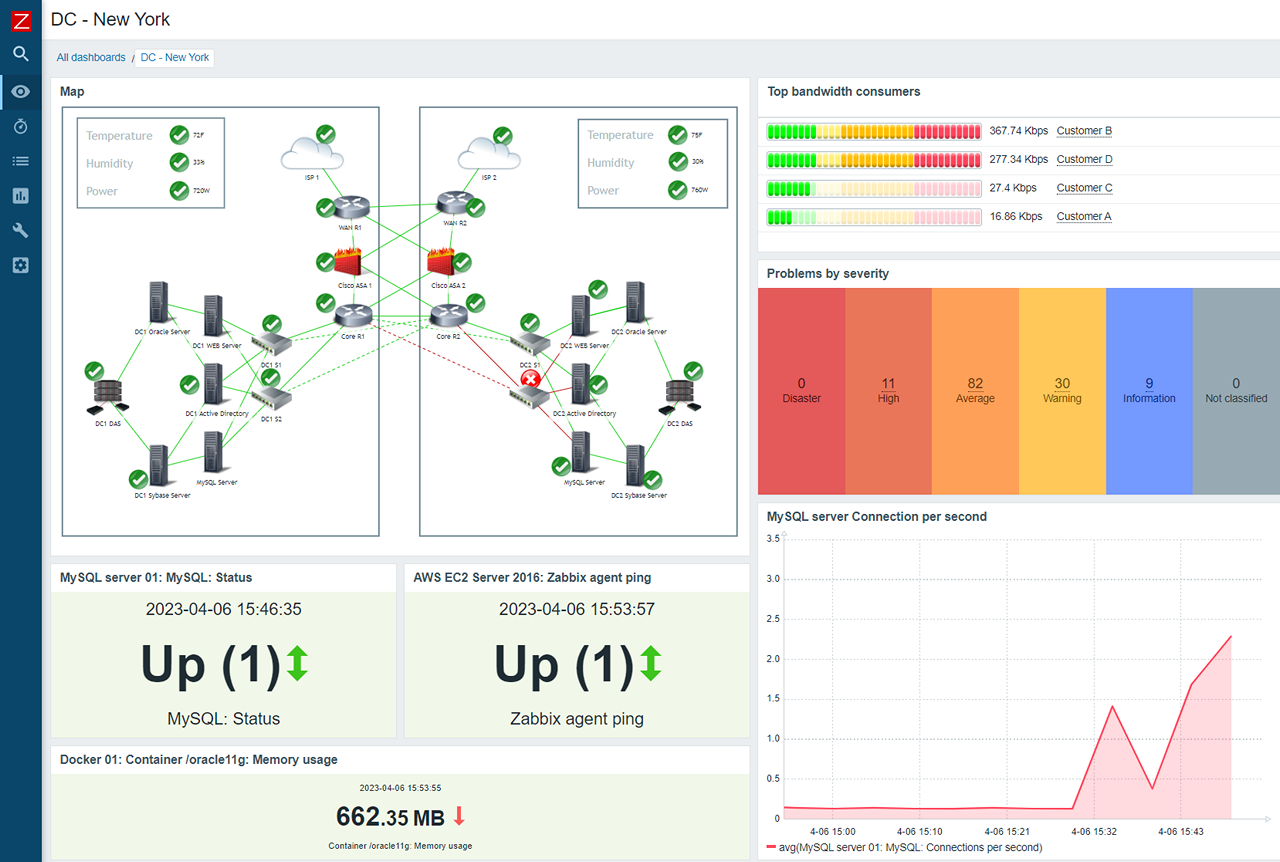
Under Dashboards, create a new dashboard or edit an existing one. Add widgets such as Graph or Latest Data to display the Modbus items. Use a <