Mastering Telegraf: Configuration, Setup, and Best Practices
If you’ve ever wrestled with metrics collection, you know that the devil is in the details. This Telegraf configuration guide walks you through the essential steps to get the agent up and running, then dives into the tweaks that turn a functional install into a reliable, low‑overhead data pipeline.
Why Telegraf? A Quick Overview
Telegraf is InfluxData’s pluggable agent for gathering time‑series data. It shines because it’s lightweight, written in Go, and supports more than 200 input and output plugins. In practice, that means you can pull metrics from Docker containers, system stats, or even custom scripts, and ship them directly to InfluxDB, Prometheus, or a cloud service—all without a heavyweight daemon.
Getting Started: The First Run
Installation is a one‑liner on most platforms. For Debian‑based systems, run:
sudo apt-get update && sudo apt-get install telegraf
On macOS, Homebrew makes it just as easy:
brew install telegraf
Once installed, the default configuration file lives at /etc/telegraf/telegraf.conf. Before you start the service, back up this file; you’ll be editing it extensively.
Understanding the Core Sections
Telegraf’s config is divided into three logical blocks: global tags, agent settings, and plugins. Each serves a distinct purpose.
Global Tags
Tags are key‑value pairs that travel with every metric. Use them to label data by environment (env=prod) or by host (host=web01). Declaring them once saves you from adding the same metadata in every plugin.
Agent Settings
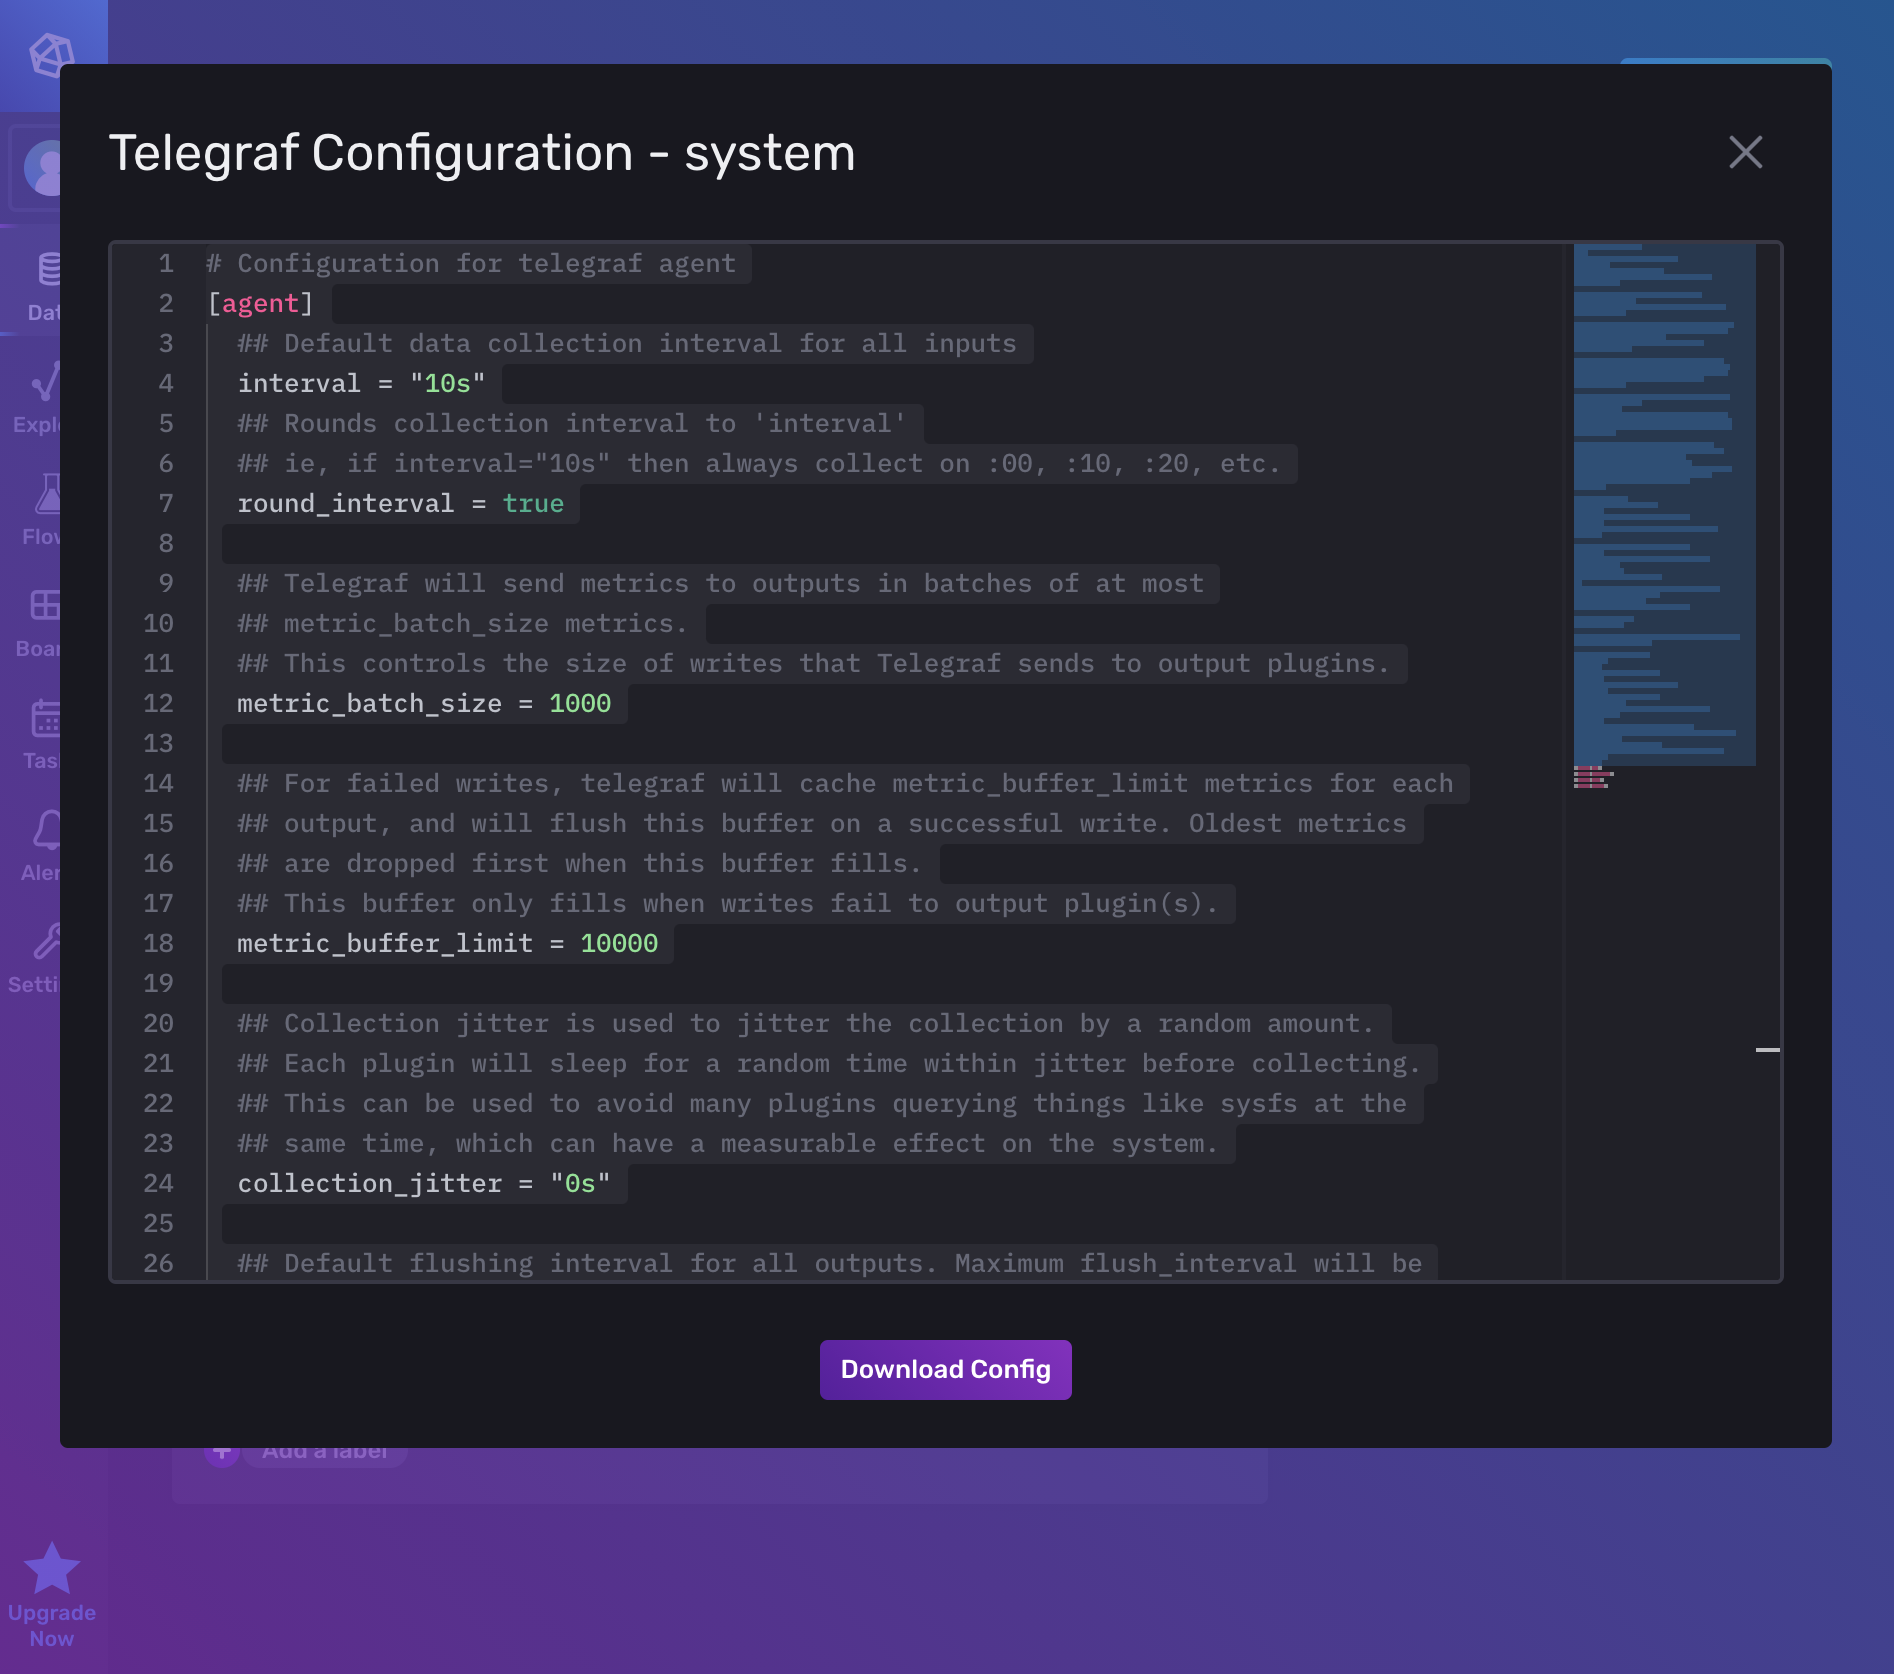
These control how Telegraf runs: the collection interval, log level, and how many concurrent writers it may spawn. A common sweet spot for most workloads is a 10‑second interval with loglevel = "info". If you’re pushing thousands of points per second, consider raising metric_batch_size to reduce network chatter.
Plugins
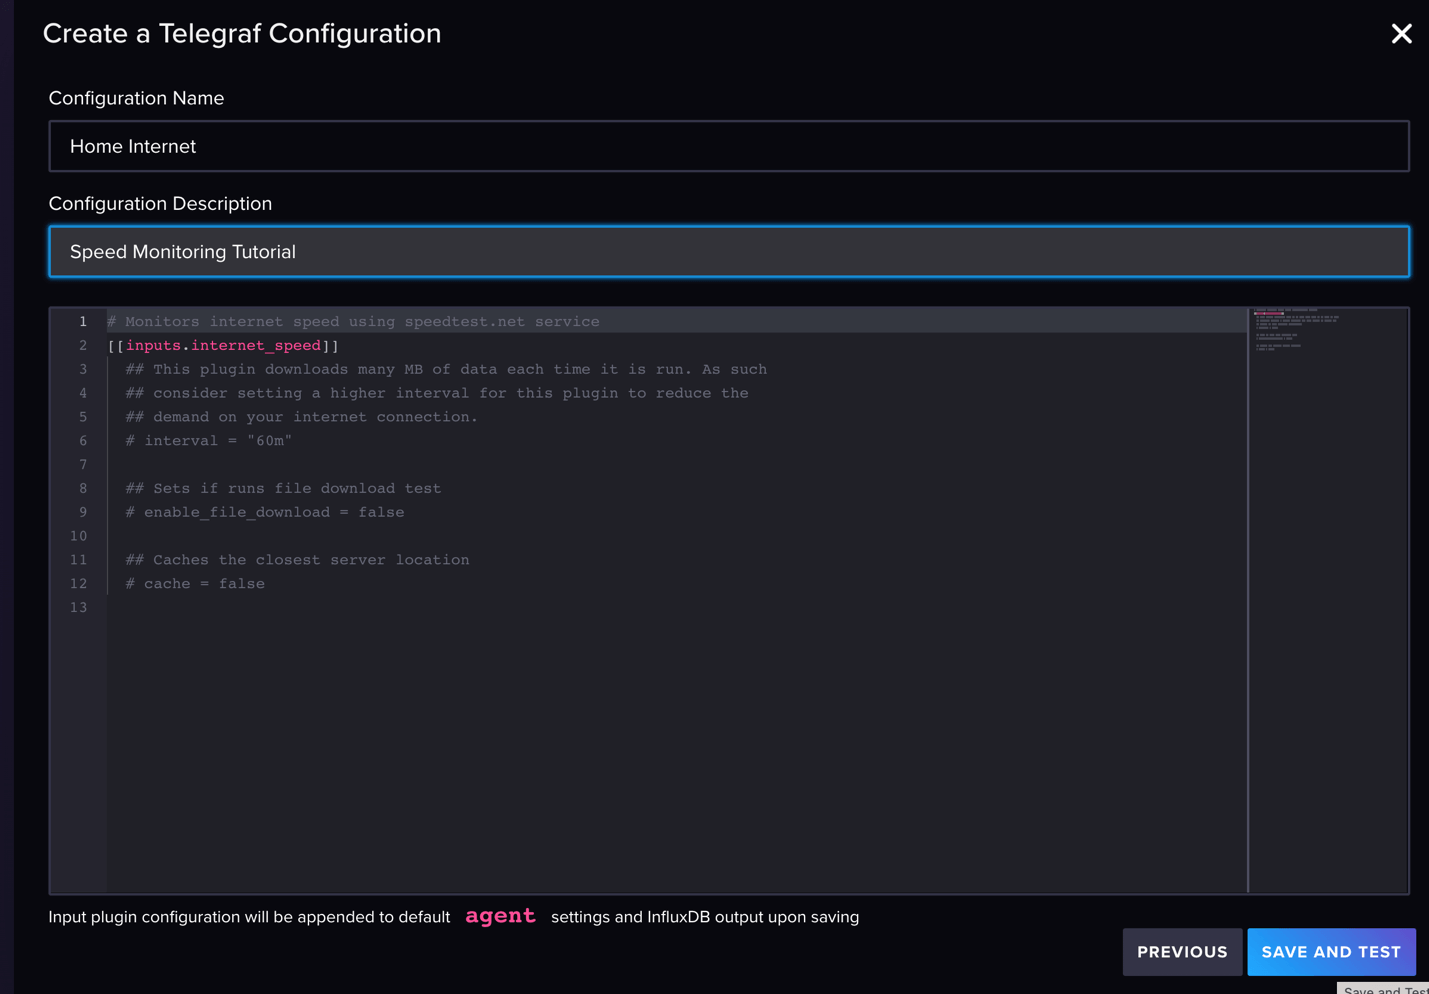
Plugins are the heart of Telegraf. Inputs pull data, processors transform it, and outputs ship it onward. You can enable a plugin by removing the leading # from its section header. For example, to monitor CPU usage:
[[inputs.cpu]]percpu = true
totalcpu = true
Remember to pair each input with an appropriate output; otherwise the data sits in memory and never reaches its destination.
Best‑Practice Checklist
Even a perfectly valid config can cause headaches if you ignore a few operational habits. Below is a concise checklist you can paste into a README or run as a pre‑deployment script.
- Pin plugin versions. Use the same Telegraf binary across all hosts to avoid subtle metric format changes.
- Enable health checks. The
[[inputs.health]]plugin surfaces internal errors as metrics you can alert on. - Leverage buffering. If network latency spikes, set
output_buffer_sizeso Telegraf queues points instead of dropping them. - Isolate high‑frequency inputs. Run a dedicated Telegraf instance for fast‑changing metrics (e.g., container stats) to keep the main agent lean.
- Use templated tags. Variables like
{{hostname}}ensure consistency without hard‑coding values.
Fine‑Tuning Performance
When you start scaling, the default settings may become a bottleneck. Here are three adjustments that often yield measurable gains.
Batching and Flush Intervals
Set batch_size and flush_interval in the output plugin to match the downstream system’s ingest capacity. A batch of 5 000 points flushed every 5 seconds works well for InfluxDB Cloud, while Prometheus remote write prefers smaller batches at a higher frequency.
Processor Plugins
Processor plugins let you rename fields, drop unwanted metrics, or aggregate values before they leave the agent. For example, the rename processor can shorten verbose field names, reducing storage costs downstream.
Parallelism
Adjust max_parallel under the agent section if you have many plugins running simultaneously. Too low and you’ll see latency; too high and CPU usage spikes. Test incrementally and monitor telegraf_cpu_usage to find the sweet spot.
Security Considerations
Metrics often contain sensitive identifiers—think IP addresses or user IDs. Secure your pipeline by enabling TLS on output plugins, and use environment variables for secrets instead of plain‑text values in the config file.
On Linux, you can restrict Telegraf’s permissions with a dedicated system user and group. Combine that with cap_net_raw capabilities if you need raw socket access for certain inputs, but avoid granting full root privileges.
Testing and Validation
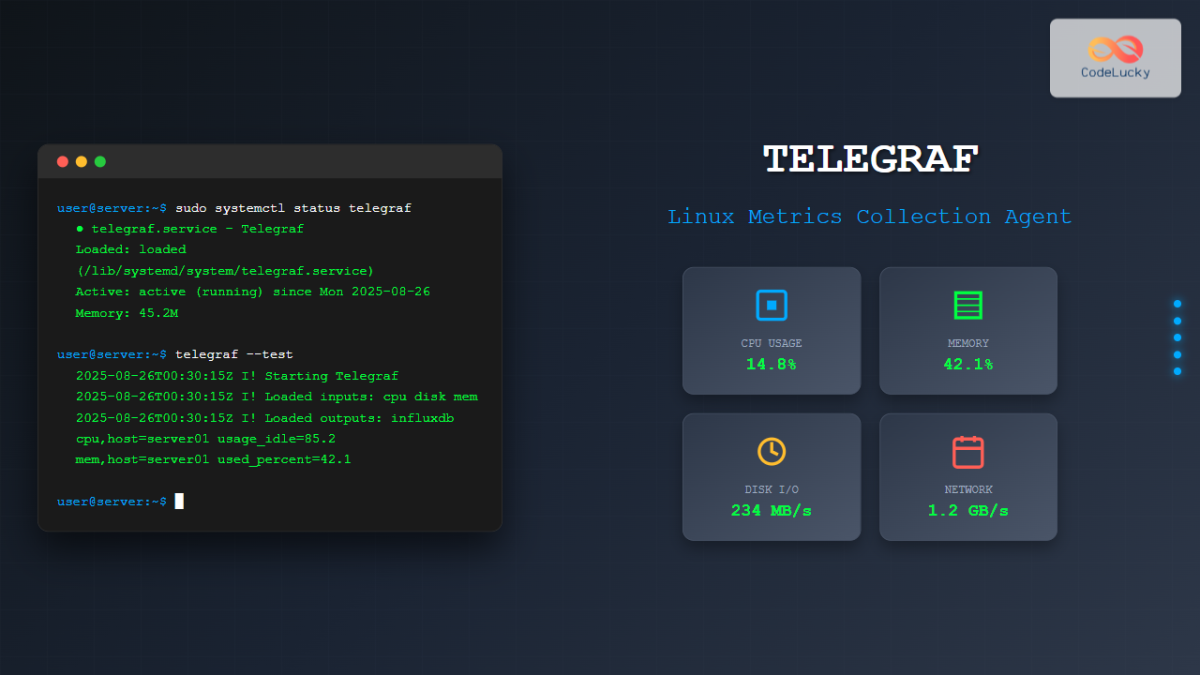
Before rolling out to production, validate the syntax with telegraf --test --config /etc/telegraf/telegraf.conf. This command prints a handful of data points to the console, confirming that each plugin can connect to its source.
For ongoing health, set up a simple alert on telegraf_agent_errors. If the count rises above zero, you know something went wrong before data loss becomes noticeable.
Frequently Asked Questions
Q: How do I reload the configuration without stopping the service?
A: Use systemctl reload telegraf on systemd‑based systems. Telegraf watches for SIGHUP and will re‑parse the config file on the fly.
Q: Can I run multiple Telegraf instances on the same host?
A: Yes. Assign each instance a unique --config flag and distinct ports for the input plugins that bind to a socket (e.g., [[inputs.socket_listener]]).
Q: What’s the best way to handle dynamic environments like Kubernetes?
A: Deploy Telegraf as a DaemonSet and use the [[inputs.kubernetes]] plugin to auto‑discover pods, services, and node metrics. Pair it with a ConfigMap for the base configuration and let the plugin fill in host‑specific details.
Q: Is there a way to limit the amount of data sent to the output?
A: The [[outputs.influxdb]] plugin supports max_batch_size and max_buffer_size. Additionally, you can use the [[processors.drop]] plugin to filter out low‑value metrics before they’re written.
With the steps above, you should feel confident turning a vanilla Telegraf install into a finely tuned collector that respects both performance and security constraints. Happy metric gathering!






.jpg)


