Understanding Nominal, Ordinal, Interval, and Ratio Scales
When researchers talk about measurement, they often refer to four basic scale types: nominal, ordinal, interval, and ratio. These scales are the backbone of data collection and statistical analysis, yet many people confuse their meanings and when to use each one. In this guide we’ll break down every scale type, give clear examples, and show how they shape the questions we ask, the data we collect, and the conclusions we draw. Whether you’re designing a survey, interpreting a study, or simply brushing up on statistics, this primer will give you a solid foundation.
What Are Nominal, Ordinal, Interval, and Ratio Scales?
At a high level, each scale provides a different level of measurement precision and dictates the kinds of statistical operations that are valid.
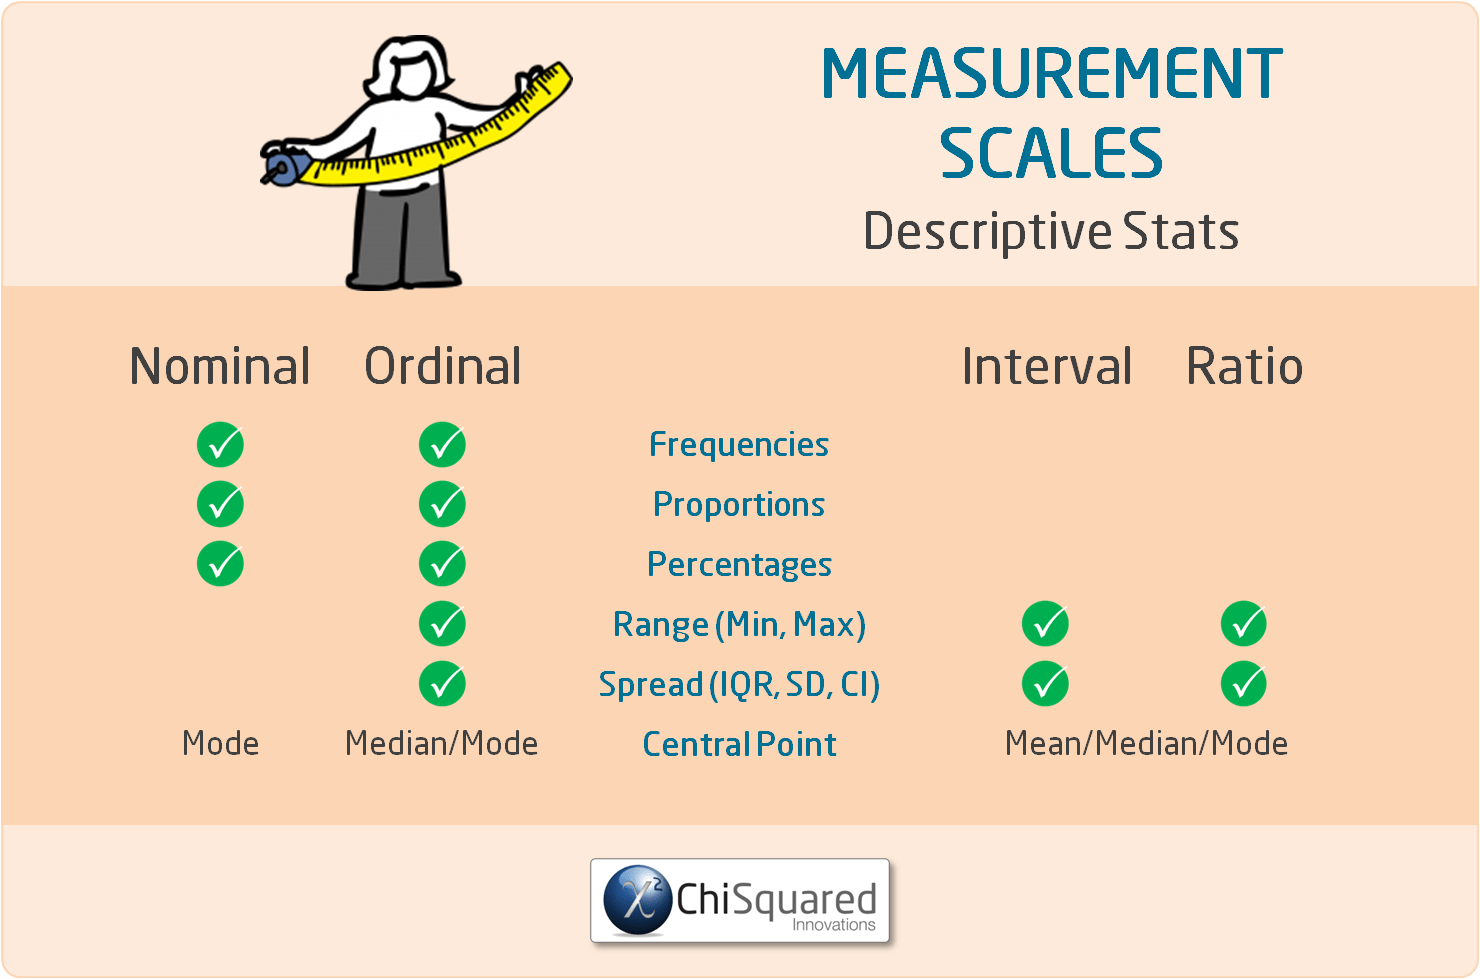
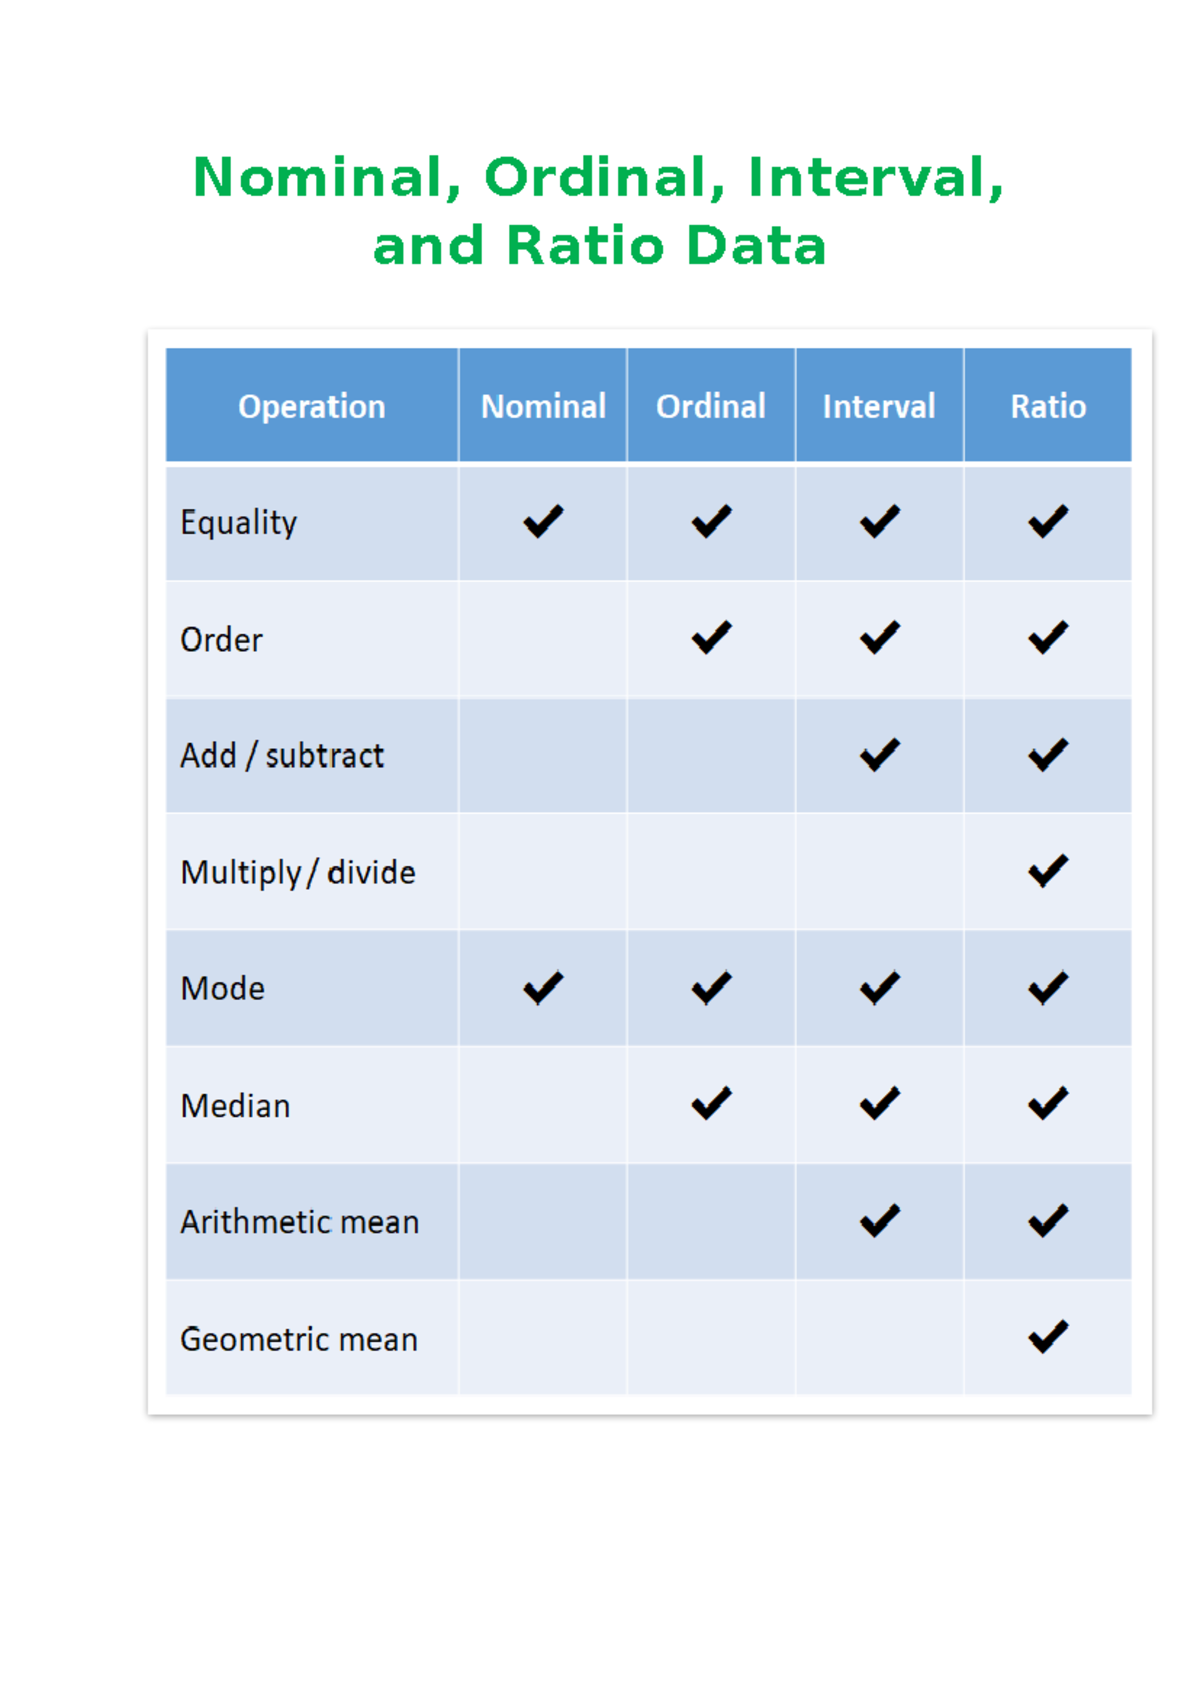
- Nominal: Categorical data that can be counted but not ordered. Examples: gender, eye color, or zip code. The only meaningful operation is frequency counts.
- Ordinal: Categorical data with a natural ranking. Examples: survey Likert ratings, class standings, or competition results. We can say one is higher or lower, but the magnitude of difference is not defined.
- Interval: Numeric data with equal intervals but no true zero. Temperature in Celsius or Fahrenheit, dates on a calendar, and IQ scores fall here. We can add and subtract, but ratios (e.g., “twice as hot”) are meaningless.
- Ratio: Numeric data with equal intervals and an absolute zero that represents the absence of the measured property. Weight, height, income, and reaction time are classic ratio examples. Both addition/subtraction and true ratios (e.g., “double the weight”) are valid.
Choosing the correct scale isn’t just academic—it determines which statistical tests are appropriate and what conclusions you can legitimately report.
Nominal Scale in Practice
Nominal data groups observations into distinct categories. Think of a health survey that asks participants to identify their primary language. Each language is a unique label, but no language is “greater” or “less” than another. Because the values are purely symbolic, the only operations we can perform are:
- Counting how many respondents chose each language.
- Calculating percentages of each category.
- Creating contingency tables to examine relationships between nominal variables.
Statistical tools suited for nominal data include chi-square tests of independence and Fisher’s exact test. They test whether the distribution of one variable differs across levels of another.
Ordinal Scale: Ranking and Order Matters
Ordinal data introduces a rank order. A common example is a 5‑point satisfaction scale: “Very Dissatisfied” through “Very Satisfied.” While you can say one rating is higher than another, you can’t infer that the difference between “Neutral” and “Satisfied” is the same as between “Satisfied” and “Very Satisfied.”
Because of this, non‑parametric tests are preferred when analyzing ordinal data. The Mann‑Whitney U test compares two independent groups, and the Kruskal‑Wallis test extends this comparison to more than two groups. These tests rely on ranks rather than raw values, avoiding assumptions about interval equality.
When to Treat Ordinal Data as Interval?
In practice, researchers sometimes treat ordinal scales as interval, especially when the number of points is large and the differences between adjacent categories appear roughly equal. However, this assumption should be justified. Misclassifying an ordinal scale as interval can lead to misleading conclusions, such as using a t‑test when a non‑parametric alternative is more appropriate.
Interval Scale: Equal Steps Without an Absolute Zero
Interval data allows arithmetic operations because the distance between any two points is meaningful. The Celsius temperature scale is a textbook example. A shift from 10°C to 20°C represents the same interval as 30°C to 40°C. However, 0°C does not mean the absence of temperature; it's merely an arbitrary reference point.
Consequently, while addition and subtraction are valid (e.g., “the temperature increased by 5°C”), ratios are not. Saying “20°C is twice as hot as 10°C” is incorrect because the zero point is not absolute.
Statistical analysis of interval data typically involves parametric tests such as t‑tests, ANOVA, or linear regression. These tests assume a normal distribution of the underlying measurement, a property usually satisfied by interval data.
Ratio Scale: The Most Powerful
Ratio data combines all the properties of interval data and adds a true zero point. Weight is the quintessential ratio variable; a person weighing 0 kg indeed has no weight. This property allows meaningful ratios: a 20 kg object is twice as heavy as a 10 kg object.
Because ratio data provide full numeric information, they support all arithmetic operations and permit the use of more sophisticated statistical techniques, such as weighted averages, geometric means, or multiplicative models. The presence of a true zero also means that descriptive statistics like the coefficient of variation are meaningful.
Practical Examples in Everyday Research
Consider a marketing firm measuring customer engagement. They might record:
- Nominal: Customer gender.
- Ordinal: Satisfaction level on a 1‑5 scale.
- Interval: Time of day measured in hours.
- Ratio: Amount of money spent in dollars.
Choosing the correct scale informs the statistical toolbox. For instance, to assess whether spending differs by gender, a t‑test or ANOVA on ratio data is suitable, while a chi-square test would be used to examine gender distribution across satisfaction levels.
Common Pitfalls to Avoid
1. Mislabeling Data: Treating ordinal data as interval can inflate type‑I error rates.
2. Ignoring Zero Points: Using ratio operations on interval data (e.g., “twice as hot”) misrepresents the underlying measurement.
3. Over‑Complex Modeling: Applying linear regression to nominal predictors without proper encoding (e.g., dummy variables) yields misleading results.
4. Assuming Normality: Many tests for interval and ratio data assume normally distributed residuals; always check residual plots or apply transformations if necessary.
Frequently Asked Questions
- What is the difference between interval and ratio scales? Interval scales have equal intervals but no true zero, so ratios are meaningless. Ratio scales include a true zero, allowing both interval operations and meaningful ratios.
- Can I use a t‑test on ordinal data? Typically no. Ordinal data violate the equal‑interval assumption