Using NYC Crime Map to Understand Brooklyn Neighborhood Safety
What the NYC Crime Map Shows for Brooklyn
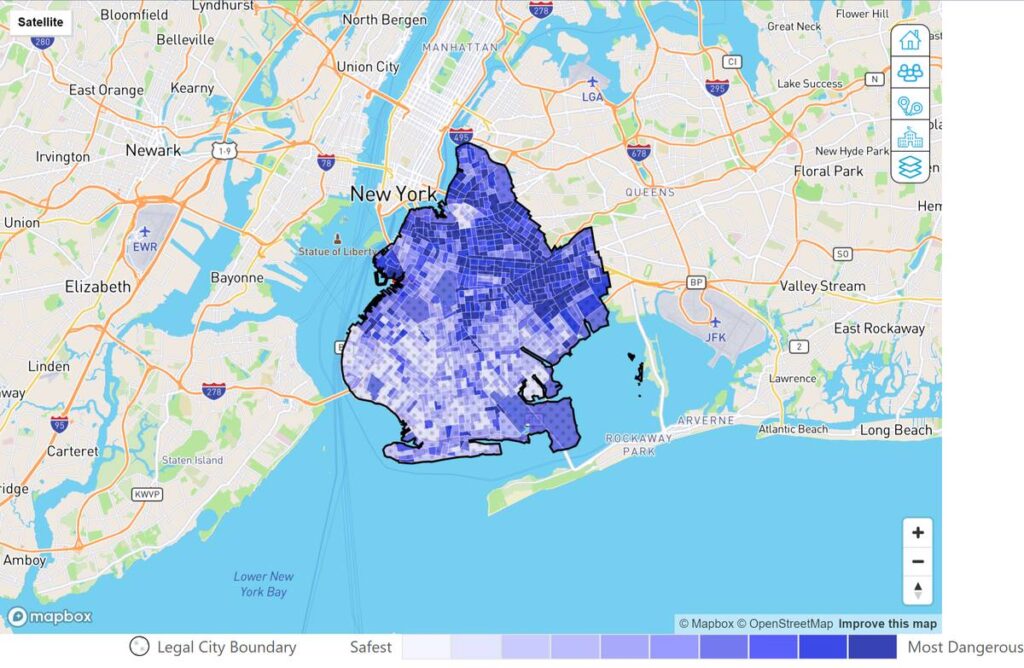
The NYC Crime Map Brooklyn is an interactive tool hosted by the NYPD that lets residents, journalists, and curious visitors visualize reported incidents across the borough. Data points range from petty thefts to more serious assaults, plotted on a street‑level grid that updates regularly. Because the map aggregates official police logs, it offers a baseline of what’s been recorded, but it’s not a crystal ball for future events.
Getting Started: Accessing the Map
First‑time users often wonder where to click. Here’s a quick walk‑through:
- Visit the official NYC Open Data portal or the NYPD’s Crime Map page.
- Select “Brooklyn” from the borough dropdown.
- Choose a date range—most people start with the past 12 months to see recent patterns.
- Toggle crime categories (e.g., “Grand Larceny,” “Robbery,” “Felony Assault”) to narrow the view.
After setting those filters, the map refreshes with color‑coded pins. Darker shades typically signal higher incident density, while lighter spots indicate fewer reports.
Reading the Data: Heat Maps vs. Pins
Two visual modes dominate the interface: a classic pin view and a heat‑map overlay. Pins give precise locations, useful if you’re scouting a specific address. Heat maps, on the other hand, aggregate nearby reports, letting you spot “hot zones” where crime clusters. When you hover over a pin, a tooltip reveals the offense type, date, and precinct.
Remember that a high concentration doesn’t automatically mean a neighborhood is unsafe. Some areas—like busy commercial corridors—naturally attract more police calls simply because more people are present.
Neighborhood Snapshots: What the Numbers Reveal
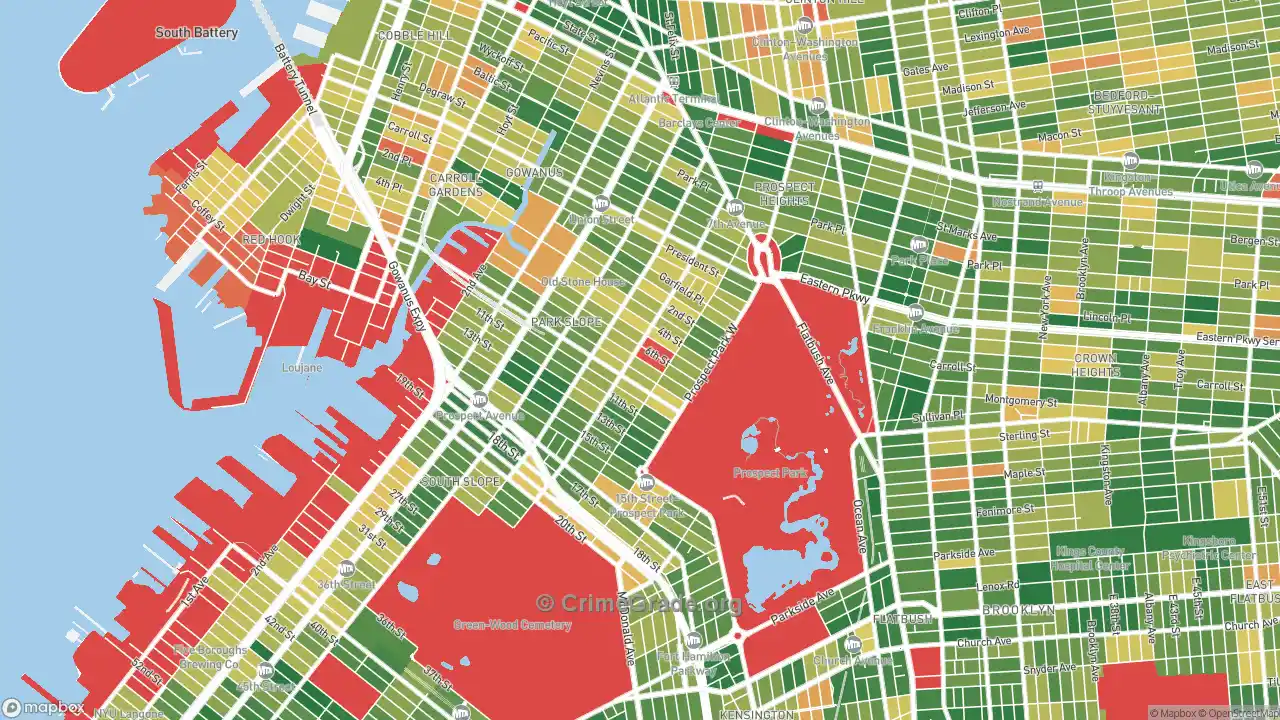
Brooklyn’s diverse enclaves each tell a different story. In the past year, Williamsburg and Bushwick showed spikes in bicycle thefts, a reflection of the borough’s thriving bike‑share culture. Meanwhile, neighborhoods such as Bay Ridge and Park Slope recorded lower overall violent‑crime rates, though they still see occasional property crimes.
These trends can be cross‑checked with census data to understand socioeconomic factors that often correlate with crime. For instance, areas with higher renter turnover sometimes see more property‑related offenses, while neighborhoods with robust community policing programs may report fewer violent incidents.
Limitations: What the Map Doesn’t Capture
No tool is perfect, and the NYC Crime Map is no exception. First, the data relies on reported incidents; crimes that go unreported—like certain domestic abuse cases—won’t appear. Second, the map reflects police classifications, which can shift over time as policies evolve. Finally, the interface aggregates data at the precinct level, so micro‑variations within a block can be smoothed out.
Because of these gaps, it’s wise to supplement the map with local news sources, community board minutes, and neighborhood watch groups for a fuller picture.
Practical Tips for Using the Map When Moving or Visiting
If you’re considering a move to Brooklyn, the crime map can help you compare neighborhoods side by side. Here are three practical steps:
- Set the same date range for each area you’re evaluating to ensure a fair comparison.
- Focus on the categories that matter most to you—families might prioritize “Assault” and “Sexual Offense,” while cyclists will look closely at “Bicycle Theft.”
- Combine map insights with on‑the‑ground observations, such as street lighting and the presence of active community centers.
For short‑term visitors, the map can guide you to well‑patrolled zones, especially after dark. While Brooklyn is generally safe, like any dense urban area, it’s sensible to stay aware of your surroundings and avoid poorly lit shortcuts.
Beyond the Map: Community Resources in Brooklyn
Brooklyn hosts a robust network of safety initiatives. The 70th Precinct, for example, runs a “Neighborhood Watch” program that encourages residents to report suspicious activity directly. Local non‑profits like Brooklyn Community Safety Council hold quarterly town halls where police and citizens discuss trends spotted on the crime map.
Engaging with these groups not only provides real‑time updates but also offers a channel to influence policy—something the static map can’t do.
Frequently Asked Questions
How often is the NYC Crime Map updated?
The map refreshes weekly with data from the NYPD’s CompStat system, meaning you’re looking at relatively recent information, though there can be a short lag for new reports.
Can I download the raw data for analysis?
Yes. The NYPD’s Open Data portal lets you export crime logs in CSV format, which you can then filter, chart, or combine with other datasets like housing prices.
Is the map reliable for predicting future crime?
It’s a useful reference for past patterns but not a predictive model. Crime can fluctuate due to seasonal factors, police deployments, or sudden community initiatives, so treat the map as a historical snapshot rather than a forecast.
Do I need a special browser or software to use the map?
No special tools are required. Modern browsers like Chrome, Firefox, or Edge handle the interactive features smoothly. A stable internet connection is the only real prerequisite.
![10 Most Dangerous Neighborhoods in Brooklyn, NY [Updated]](https://nycreviewed.com/wp-content/uploads/2024/01/Brooklyn-crime-map-Aug-2024-1024x584.webp)